Vision Quest
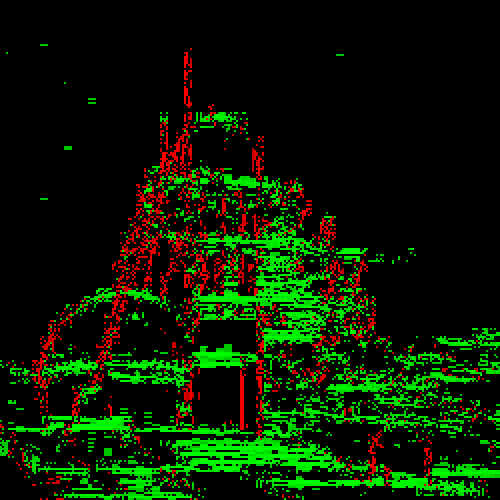
HoG - Histogram of Gradients
UFO:Detector Test
FAIL
Desert Moon - Sidereal Galaxy Ways
image courtesy of the late
Eddie Takosori
This document has not been classified by the CIDC
nor had it been documented would we be at liberty to disclose said rating
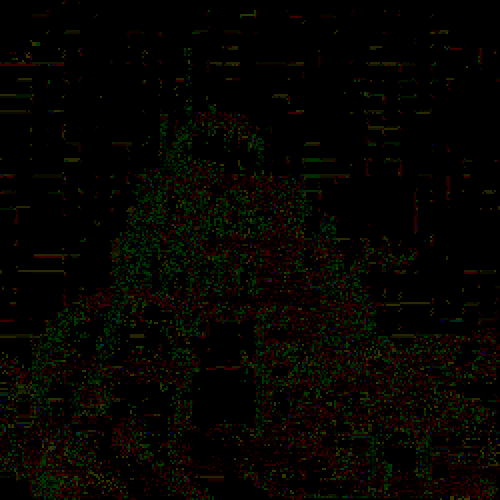
I'm I am the curator Eddie's life work, this photo comes from his personal effects. Make of it what you will.
First an image of an embassy.
Something neither the Arturians
(I think that's how it's spelled)
nor the CIDC
(once again, I'm pretty sure that's the correct acronym for the CIDC)
ever want you to see.
So, like, you didn't see it here first (if you know what I mean).
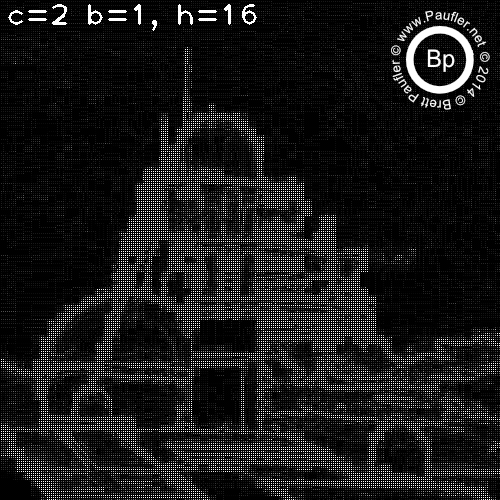
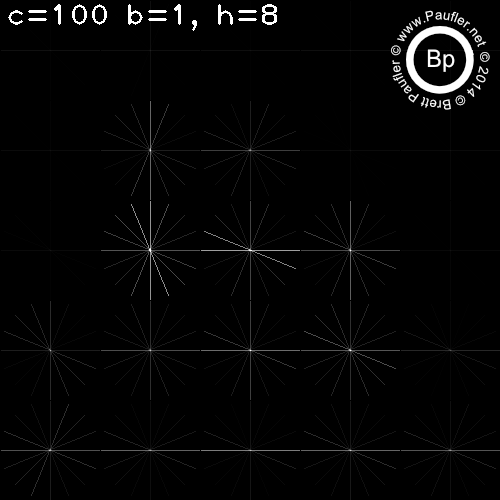
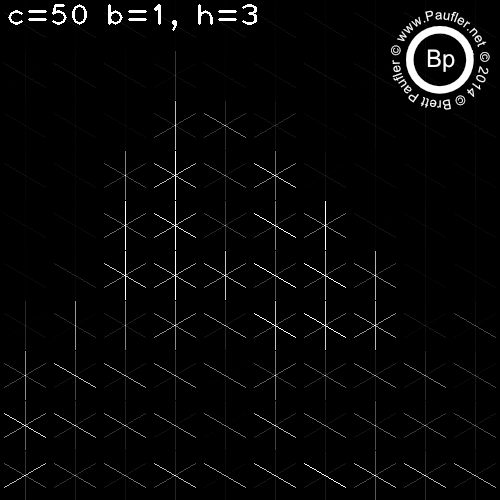
C is the Cell size. Since HoG measures a gradient, the smallest meaningful cell is (2,2).
I found no effect from changes in B (the block size) for any test run. So variance in B is omitted throughout.
For C=(2,2), there was no difference due to number of slots in the histogram (h=1,h=2,h=4,h=8 omitted).
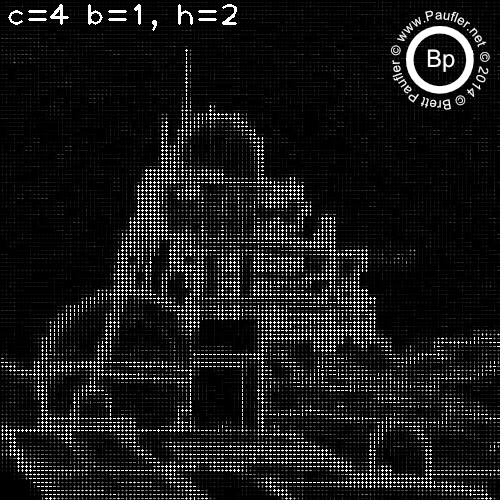
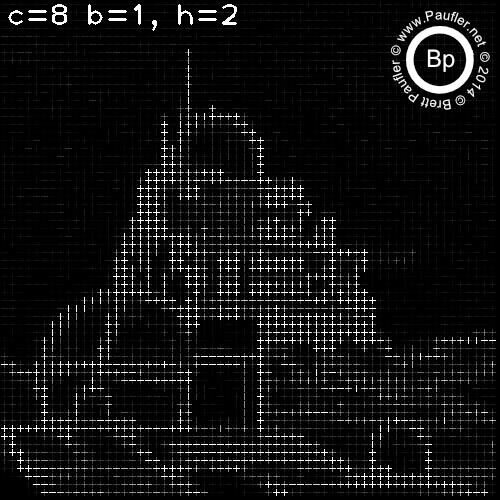
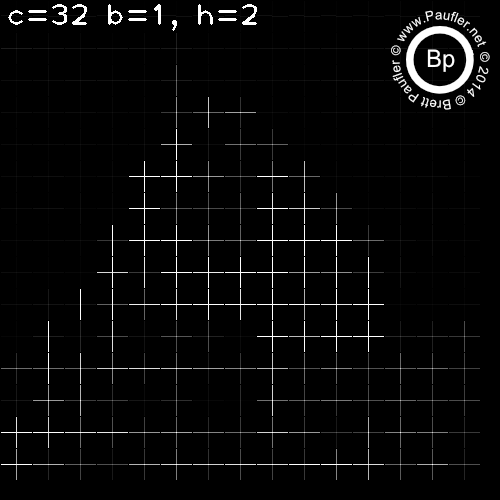
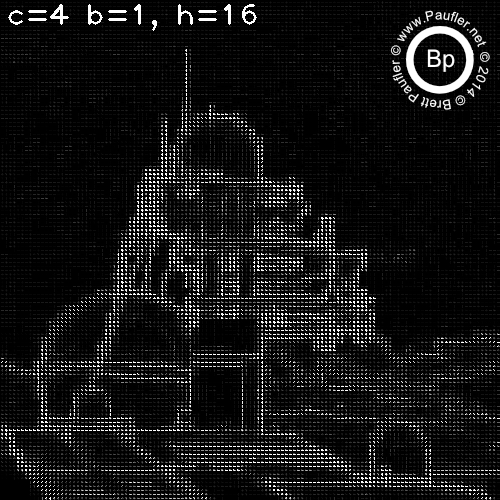
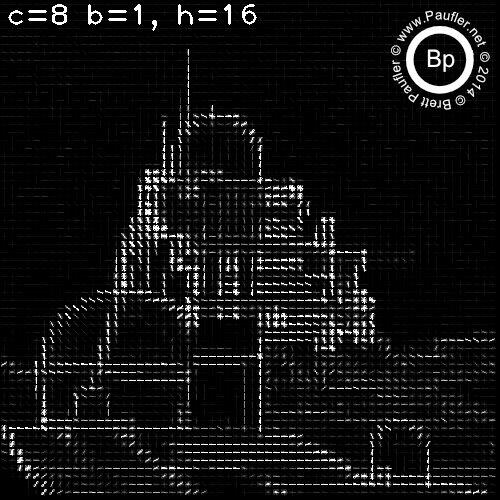
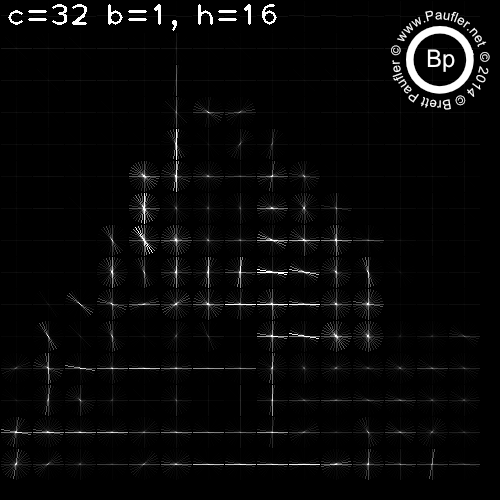
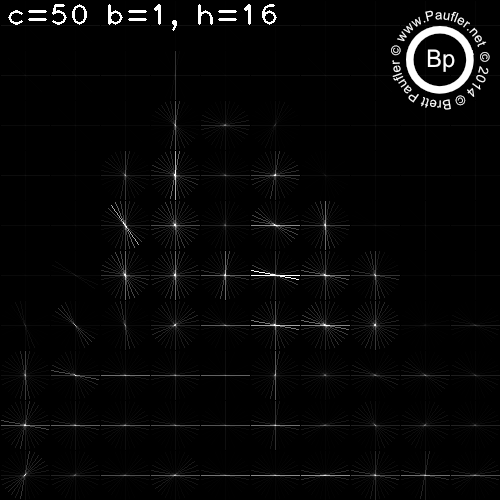
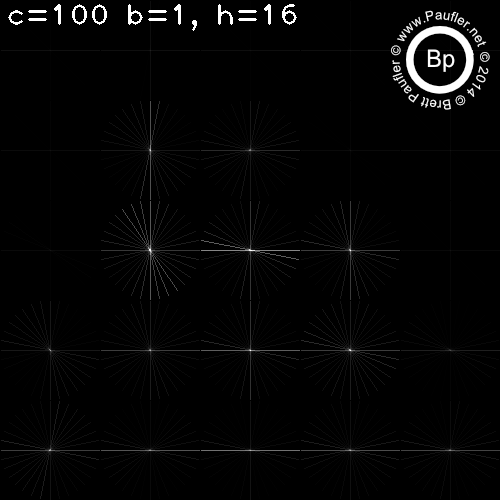
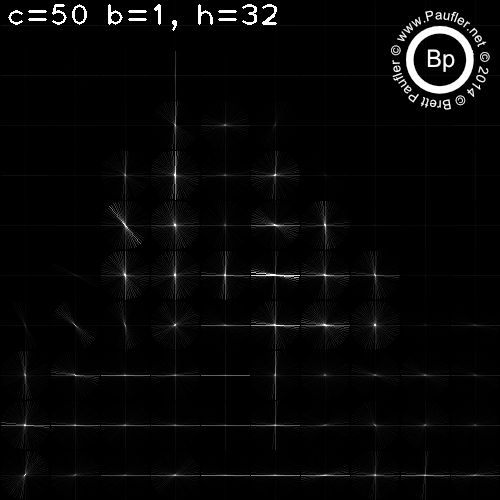
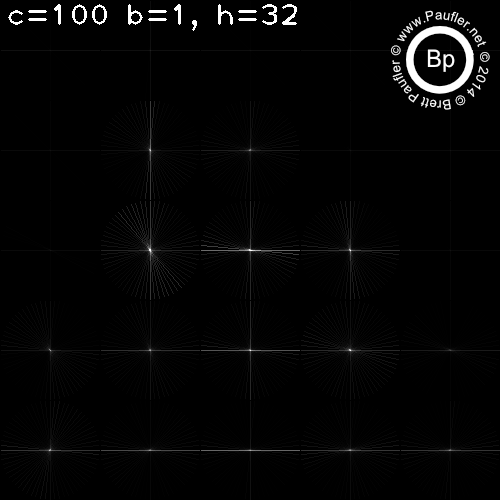
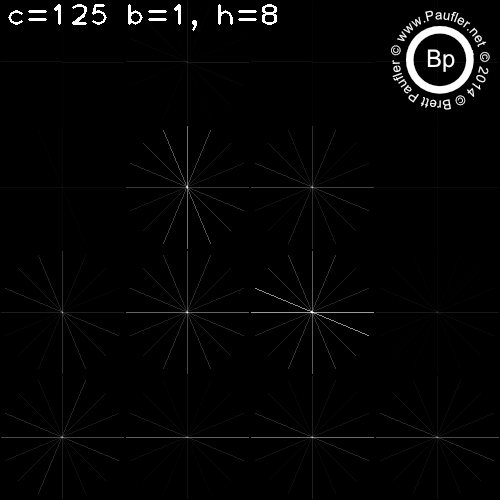
HoG - Base Test Run
C varies per column
H varies per row

Above: Two Histograms per Cell
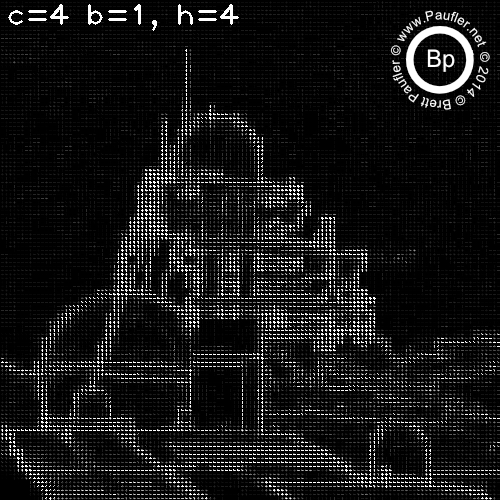


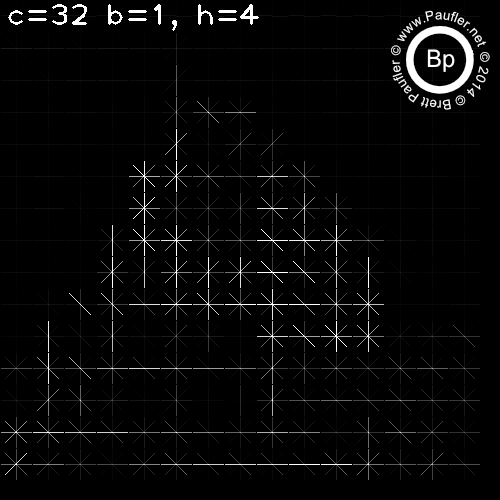
Above: Four Histograms per Cell

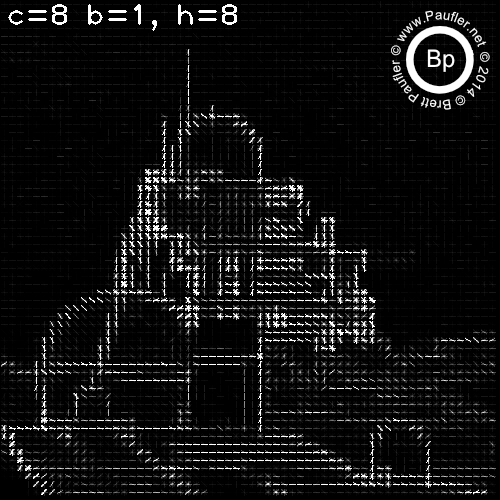
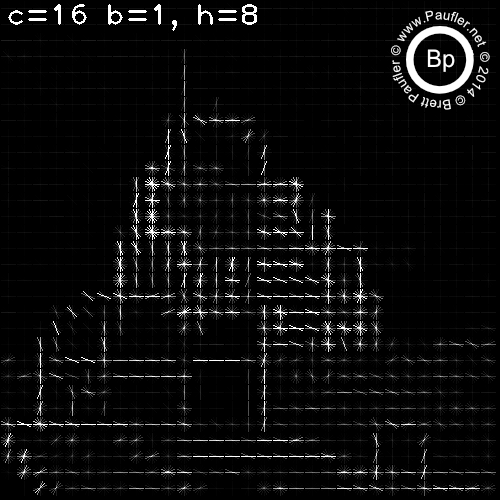

Above: Eight Histograms per Cell
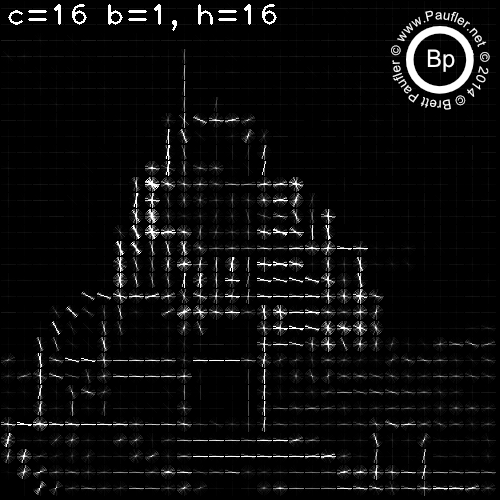
Above: Sixteen Histograms per Cell
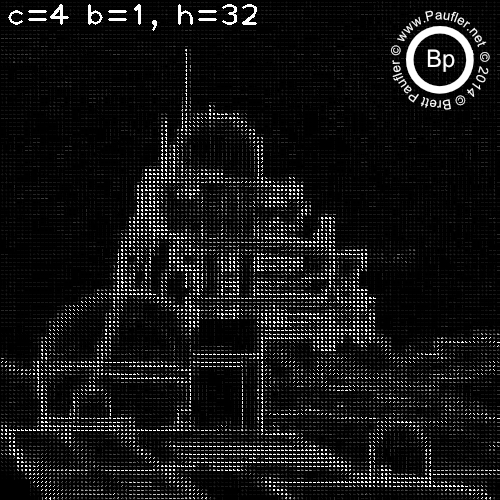

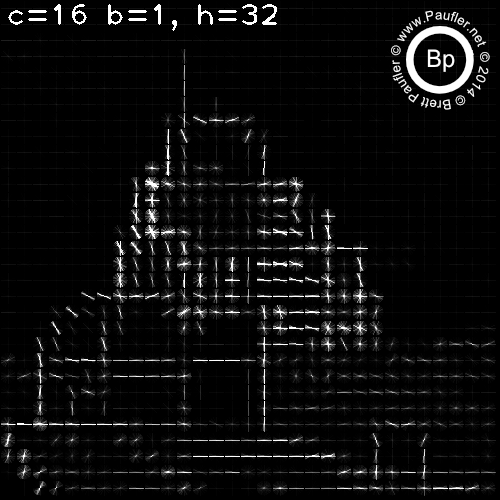
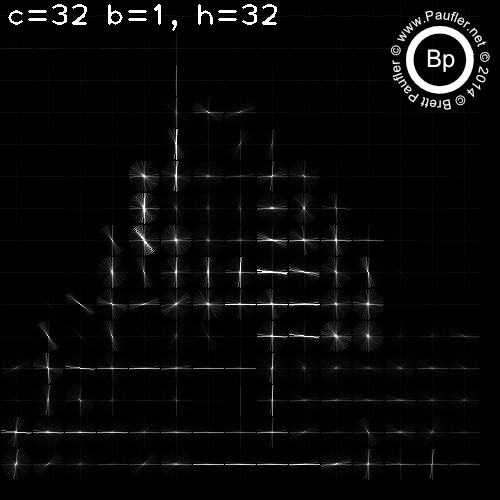
Above: Thirty Two Histograms per Cell
Same Thing - Larger Cells
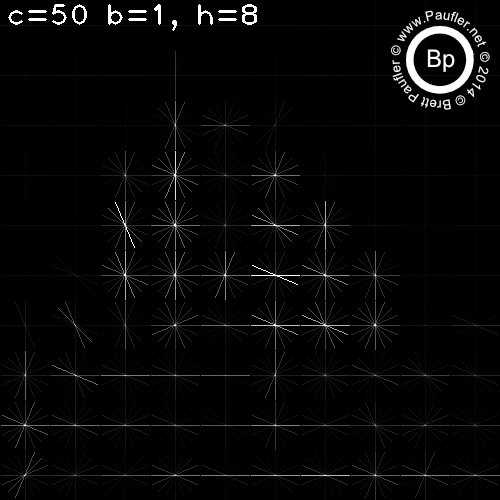
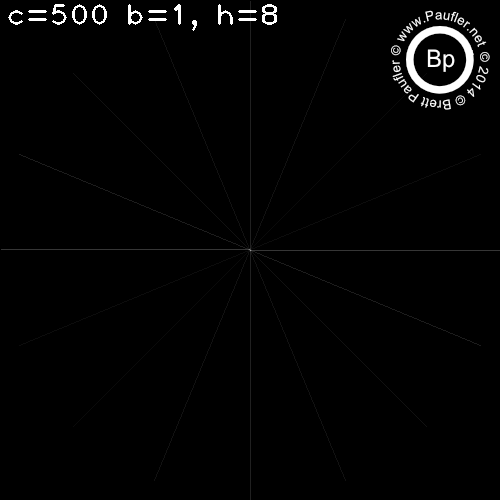
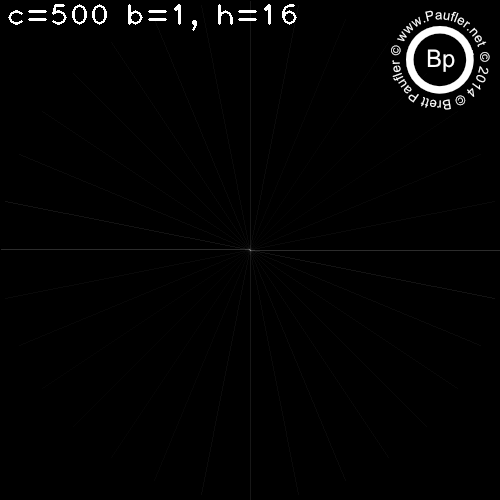

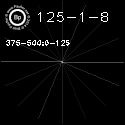
c=500 (the column on the far right) is an interesting test condition as one cell takes up the entire image.
HoG - Cell Decomposition
Above: One Image
Below: Sixteen Sub-Images


Color Test
This should be self-explainatory. But if not, in the following, I plug the histogram return values in for the standard rgb color values. Thereby, replacing the funky default star graphics of
from skimage.feature import hog with color.
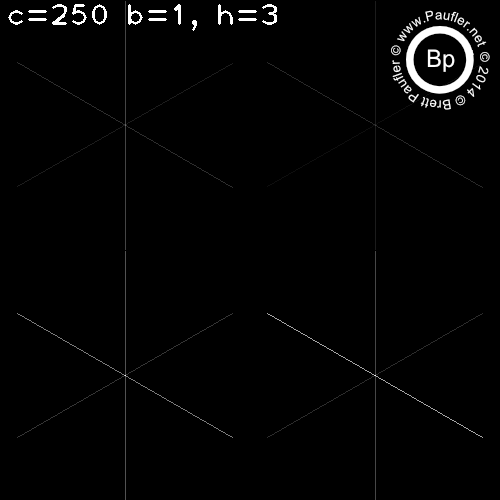
RGB images use three color layers.
If h=3, HoG kicks back three histogram values.
Rocket Science, this is not.

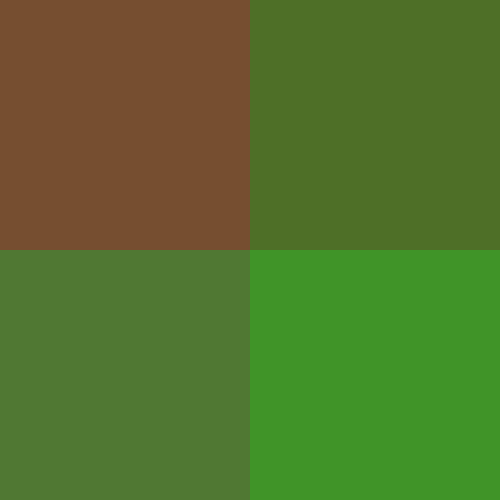
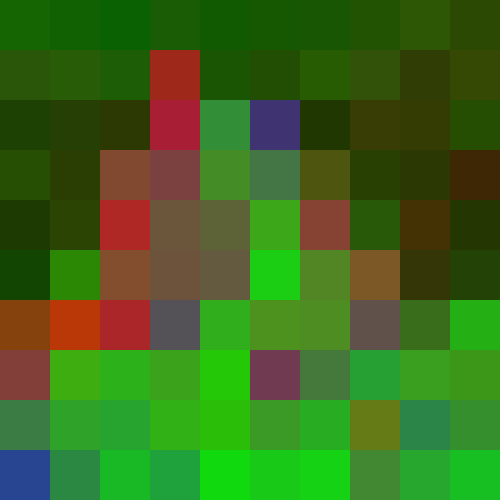
For reference: these are the raw histogram values
Presented counterclockwise, from left-top
columns are [red  green  blue]

x000-y000 [ 0.46650601  0.30661453  0.18926898]
x250-y000 [ 0.31422072  0.4707383   0.20310213]
x250-y250 [ 0.25183926  0.58050045  0.15758351]
x000-y250 [ 0.30955919  0.43543831  0.15302716]
The brightest squares match up with the highest values, so it looks right to me.
This is the combined overlay.
But at this scale, it's not very interesting, so...
which when plugged in for color yields
which still isn't very interesting, but now that the idea is clear, all we have to do is reduce the cell size to something a little more refined (i.e. a little less granular); and when we plug the histograms in for color, we get:
The image on the right has been 'stretched' (normalized) to fill the full color gradient from 0.00 to 1.00, but as there's no real difference, I won't bother with that anymore.
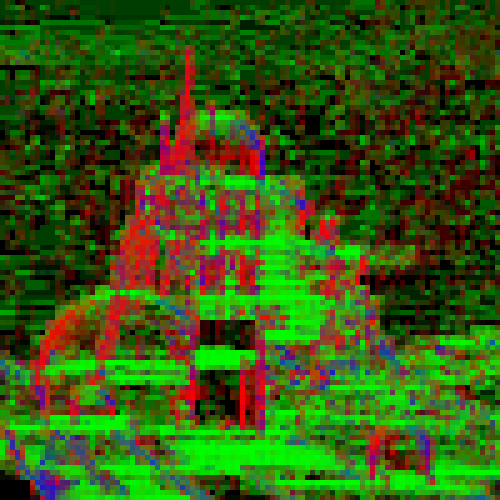
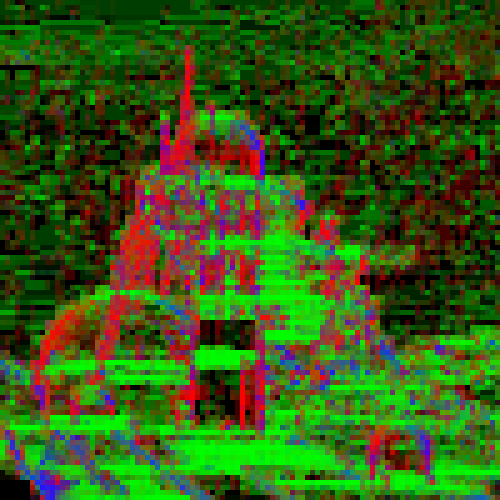
The cell size on the above is 5.
Below, it's 2.
Base colorized image, h=2.

Images passed through a low pass filter.
If color value below 0.25 on left (hogValue < 0.25),
below 0.33 or right (hogValue < 0.33)
Not stretched, so maybe I there was a reason I included a stretching function...
Above are the same images stretched (color expanded to fill the full gradient).
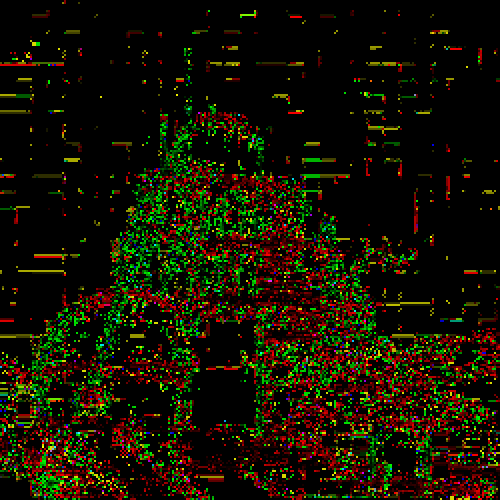
There is a lot more action (noticable) action in the air in these images, which is as one might expect, what with the humming of the Van Der Wahl drives and all.
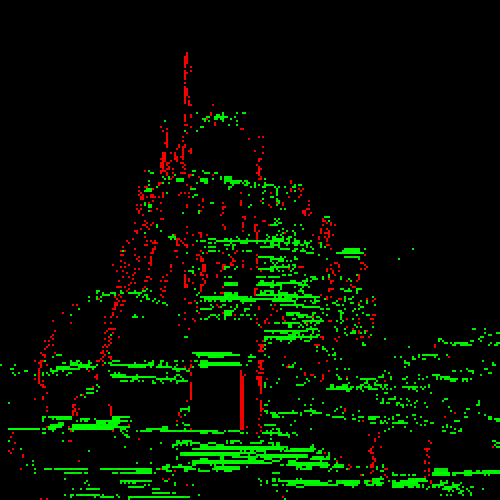
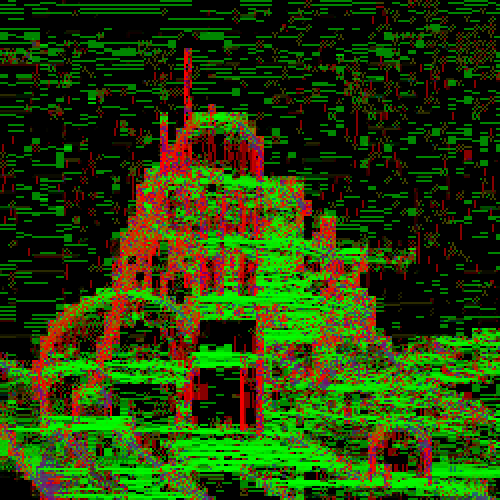
The above are after passing the results through a high pass filter.
Greater than 0.50 (hogValue > 0.50)
Greater than 0.75 (hogValue > 0.75)
Greater than 0.90 (hogValue > 0.90)
from left to right.
And I do believe I will have some pretty gif's of this at the bottom of the page, but first some code. You do like code, don't you?
HoG (Histogram of Gradients) - Python Code
First, the stretch function. Nothing fancy.
def stretch(a):
    '''normalizes the values in an array
    from 0.0 to 1.0
    '''
    a = a - numpy.min(a)
    if numpy.max(a) != 0.00:
        a = a / numpy.max(a)
    return a
Everything shown on this page (except for the animated gif's, to follow below) can be derived from judicious use of the following function.
import numpy
from skimage import io
from skimage.feature import hog

def hogFdTest(img, c=250, nH=3,
               tL=0.00, tH=1.00,
                expand=False):
    '''
        a function to play with
            from skimage.feature import hog

        img = a greyscale image array
            io.imread(sN, as_grey=True)

        c = cell size = (c,c)
            must be an integer
            2 is the lowest that will work
            up to picture size

        nH = numberHistograms
            3 works well if splitting
                to picture bands r,g,b
            as goes higher, grinds to a halt
                takes a lot of time
            as written nH must be 3 or greater

        tL and tH together form a band pass
            tL = lowest number to pass
            tH = higherst number to pass
            tL=0.00, tH=1.00
                passes everything

        expand if true
            referred to as 'stretch' in text
            renormalizes gradients
            to range 0.00 - 1.00
            regardless of the band passed

        returns
            iO = a numpy image array (w,h,4)
            hV = hog values
                a['name'] = holding name
                a['hog'] = values
                a['xS'] = xStart
                a['xE'] = xEnd
                a['yS'] = yStart
                a['yE'] = yEnd

    '''
    print "hogFdTest Starting"

    nH = int(nH)
    c = int(c)

    #creating the r,g,b,a holding arrays
    w, h = img.shape
    r = numpy.ndarray((w,h), float)
    g = numpy.ndarray((w,h), float)
    b = numpy.ndarray((w,h), float)
    a = numpy.ones_like(g, float)
    z = numpy.zeros_like(a, float)


    #splits image into chuncks
    #based on c=cellSize
    sC = [(x,y) for x in range(0,w,c)
                for y in range(0,h,c)]

    #holding object for fd arrays
    hV=[]

    for x,y in sC:

        s = img[x:(x+c),y:(y+c)]

        #fd is an array with len(fd)=nH
        fd = hog(s, orientations=nH,
                  pixels_per_cell=(c,c),
                    cells_per_block=(1, 1),
                     visualise=False)

        #creation of return value object
        #fill it with values
        #append to the return array hV
        t = {}
        t['name'] ="xy%s%s" % (nFL(x),nFL(y))
        t['hog'] = fd
        t['xS'] = x
        t['xE'] = x + c
        t['yS'] = y
        t['yE'] = y + c
        hV.append(t)

        #first three
        r[x:(x+c),y:(y+c)] = fd[0]
        g[x:(x+c),y:(y+c)] = fd[1]
        b[x:(x+c),y:(y+c)] = fd[2]

    #high pass, passes higher than tL
    r = numpy.where((r>=tL), r, z)
    g = numpy.where((g>=tL), g, z)
    b = numpy.where((b>=tL), b, z)

    #low pass, passes lower than tH
    r = numpy.where((r<=tH), r, z)
    g = numpy.where((g<=tH), g, z)
    b = numpy.where((b<=tH), b, z)

    #stretched the passed band
    #to fill the full range 0.00 - 1.00
    if expand:
        r = stretch(r)
        g = stretch(g)
        b = stretch(b)

    #assembling 4 (w,h) arrays into one
    #(w,h,4) array RGBA
    iO = numpy.dstack((r,g,b,a))

    sN = "ufo_%s_%f-%f.png" % (nFL(c), tL, tH)
    print "hogFdTest saving %s" % sN
    io.imsave(sN, iO)

    #We'll play with hV in a moment
    return iO,hV
'''
#Example test code for hogFdTest
#Bandpass filter
for r in range(0,100,10):
    r = r/100.00
    hogFdTest(io.imread(sN, as_grey=True),
              c=2, nH=3, tL=(r), tH=(r+0.10),
              expand=True)
'''
The above includes a hV return value, which the code below plays with a little (but just a little).
def analyzeHOGValues(img):
d, h500 = hogFdTest(img, c=500)
d, h250 = hogFdTest(img, c=250)
d, h125 = hogFdTest(img, c=125)
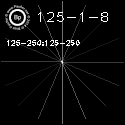
print "Sum of Gradients Full Image"
print "h500 : " + str(sum(item['hog']
for item in h500))
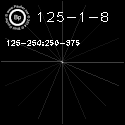
print "h250 : " + str(sum(item['hog']
for item in h250)/len(h250))
print "h125 : " + str(sum(item['hog']
for item in h125)/len(h125))
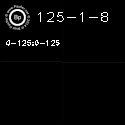
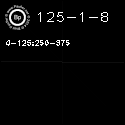
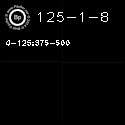
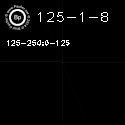
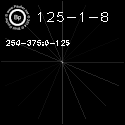
print "250 vs 125 Corner Test"
c = [item['hog'] for item in h250 if
(item['xE'] <= 250) and
(item['yE'] <= 250)]
print "h250 : " + str(sum(c)/len(c))
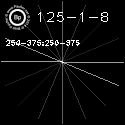
c = [item['hog'] for item in h125 if
(item['xE'] <= 250) and
(item['yE'] <= 250)]
print "h125 : " + str(sum(c)/len(c))
sN = "./butterfly/png/UFO-500x500.jpg"
img = io.imread(sN, as_grey=True)
The output for the above being:
Sum of Gradients Full Image
h500 :  [ 0.32074886  0.47799351  0.1798315 ]
h250 :  [ 0.33553129  0.4483229   0.17574545]
h125 :  [ 0.26137455  0.42913492  0.12500847]

250 vs 125 Corner Test
h250 :  [ 0.46650601  0.30661453  0.18926898]
h125 :  [ 0.29768439  0.32754795  0.09223276]
Um?
I do believe I read somewhere that one of the reasons HoG got so much play was due to it's resistance to changes in scale.
So, much for that notion.
The above clearly demonstrates either:
A: My utter lack of understanding as to what the HoG gradient values mean, or
B: There is a wide variance based on scale
Do to reasons of Super-Ego-Id Overwhelming-Superiority of My Nature, I choose to believe it is the latter.
HoG Tied - Wrapping It Up
And that's about it. A few more pretty pictures, maybe a witty commentary or two, and I do believe that will be all.


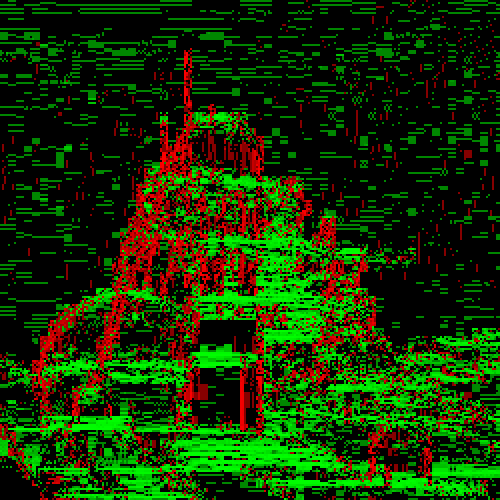
0.10 Bandpass on the Left : 0.25 Bandpass on the right
Split by band in the top row above.
Additive (increasing window size from 0.00-0.10 to 0.00-1.00) underneath.
And then, below, we have the same thing, only cell size is 2 (bandpass top row, additive below).

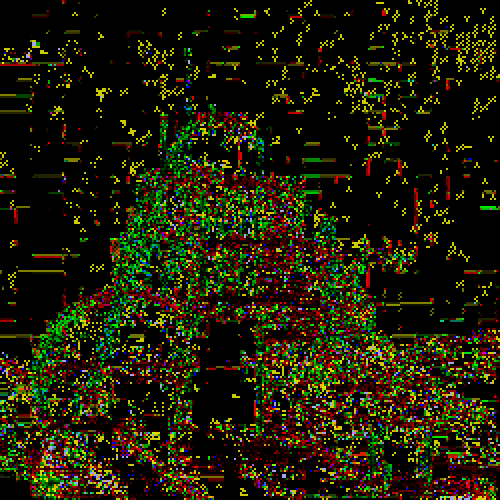
And there you have it. It being, of course, the yellow tri-wing aerial assault vehicles that can be seen hovering in the background once one dials the 'scanner' in to the right frequency.
Obviously, it's all hush-hush, need to know, probably some diplo-corps mission debriefing thingy. Anyway, we all know who flies around in those 'tri's', so no sense belaboring the point.
The news will hit the Ethers soon enough.
Just remember, you heard it here first.
Or on second thought, I haven't said a thing.
Haven't said enough.
Already said to much.
Or if you want to believe I mess around with these things because I am of fan of graphic art, well, if that's the case, darned if I know what I'm going to do with this new tech. Maybe I've just been playing with the wrong images...
HoG Color Gradient
Top Secret
CIDC Demo Page
(aka more pretty pictures like these last two)