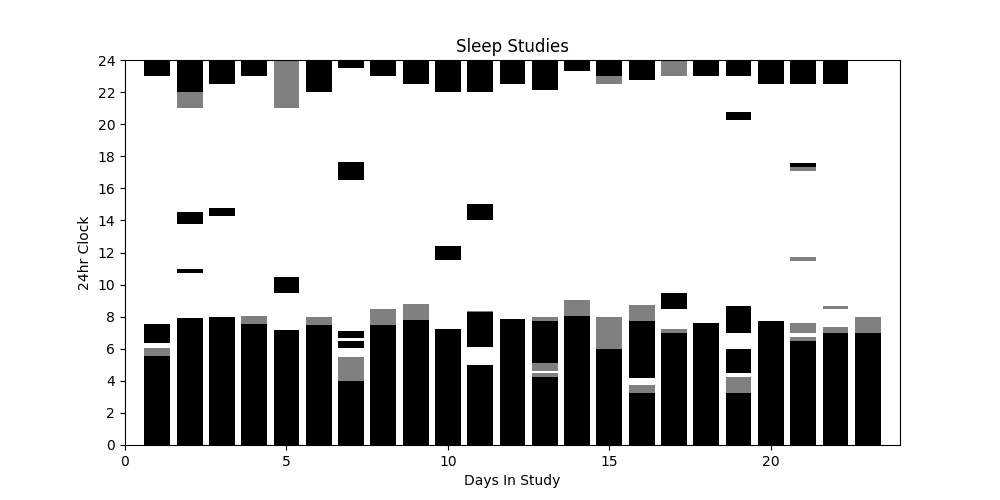
Sleep Studies Summary
DATA POINTS: 46

HOURS IN STUDY: 559.00

DAYS: 23.29


TOTAL PRE-SLEEP FUZZ: 7.30

TOTAL POST-SLEEP FUZZ: 13.63


TOTAL SLEEP:  199.15 Hours

AVERAGE SLEEP:  8.55 Hours
Please see the raw data (a link is available at the top of the page) for further elaboration. But then, the only item that should be confusing is the
FUZZ (as shown in gray in the graph above). Well, that's what I was calling that laying around in bed time, when one is not quite asleep, but trying to be so. It's not an accurate reading in the least, as I often lay awake in the middle of the night for 1-2 hours. So, like, I know the data is horrible.I determined the Average Sleep (per day) by dividing the Total Sleep by the number of Days. But trying to determine how much I slept in a typical night was more troublesome, because I had to back out naps and those times when I was awake in the middle of the night.
To try and figure this out, I eliminated shorter spans of sleep. For instance, if I removed all periods of rest less than an hour in length, I wound up with 31 sleep periods, averaging 6.2215 hours each. And with that explanation, the other possible ways of interpreting the data should make more sense.
NO NAPS(<1)=(31): 6.2215 (ave length)

NO NAPS(<2)=(26): 7.1673 (ave length)

NO NAPS(<3)=(24): 7.5625 (ave length)

NO NAPS(<4)=(23): 7.7384 (ave length)

NO NAPS(<5)=(21): 8.0714 (ave length)
After this long, I can't say I care about the data, the analysis, or anything else related to this project in the least. Further, I question whether I learned anything... except for maybe how hard it is to manually collect sleep data on oneself and a future personal preference to collect data (any sort of data) in a full-on spreadsheet rather than as an iPhone note. But then, the iPhone is by my bedside, while a computer is not. And as such, I still find my iPhone (as opposed to my Android... for legacy reasons, I am sure) to be my preferred form of dynamic (so, like, in the wild and on the fly) mode of data entry.
