CZ
Trader
C©rny News
P©p C©rn Trader
Mr GiggleWorth Futures Blog
not to be taken seriously
fact and fiction are
mixed at my fancy
do not rely on any
'information' contained on this site
complete terms and disclaimer at these links
2014 - May
This is the third entry in this series. And I feel like a Sophomore -- someone
who knows a little about the subject they are learning, but who has not
yet come to realize how little they actually know.
Starting with CZ2013
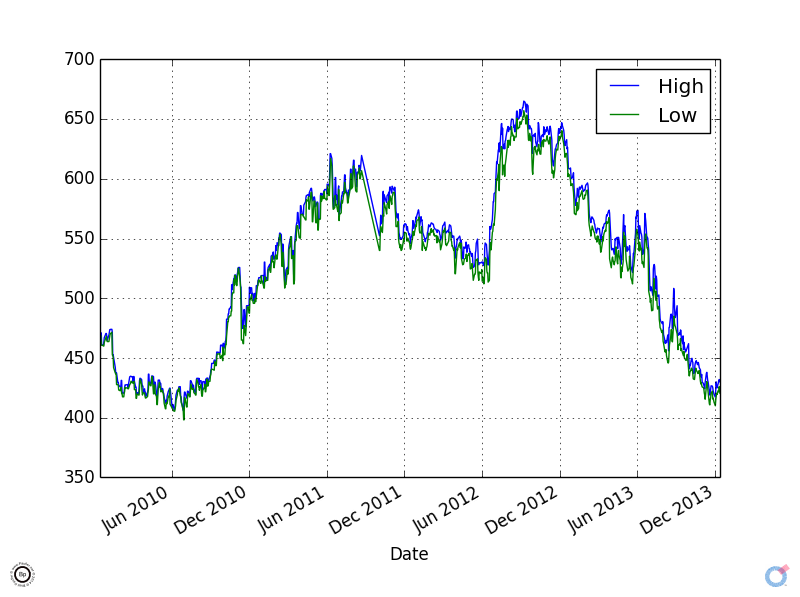
This
is s simple High-Low chart of the CZ2013 issue. Note that it spans more
than one year. And that on any given day, there's not that much
difference between the high and low given the other factors involved.
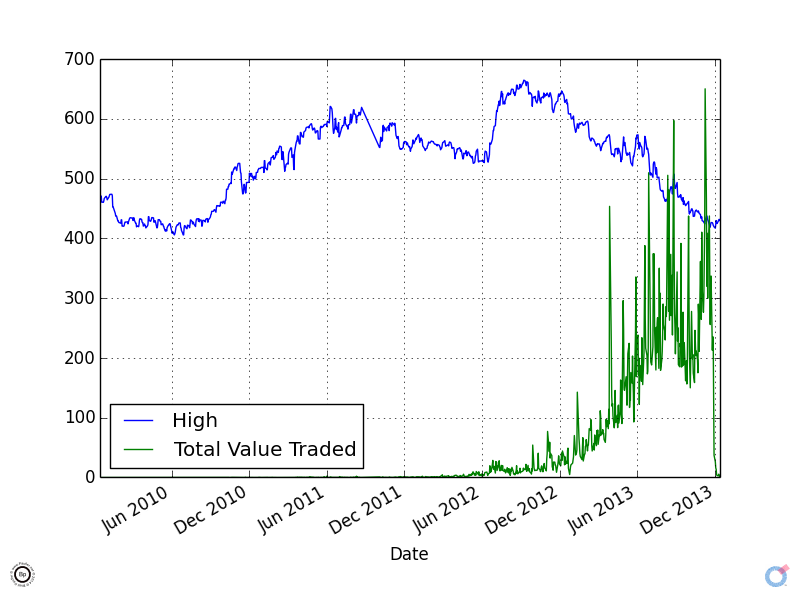
This
is the same High chart for CZ2013 as before, it looks slightly different as the
range goes all the way to zero on this one. The other line depicts the
Total Value Traded (High + Low)/2 = Average * Volume / 240,000 (so the
scale would line up). There is no obvious correlation (to my eye)
between the daily price and trade activity.
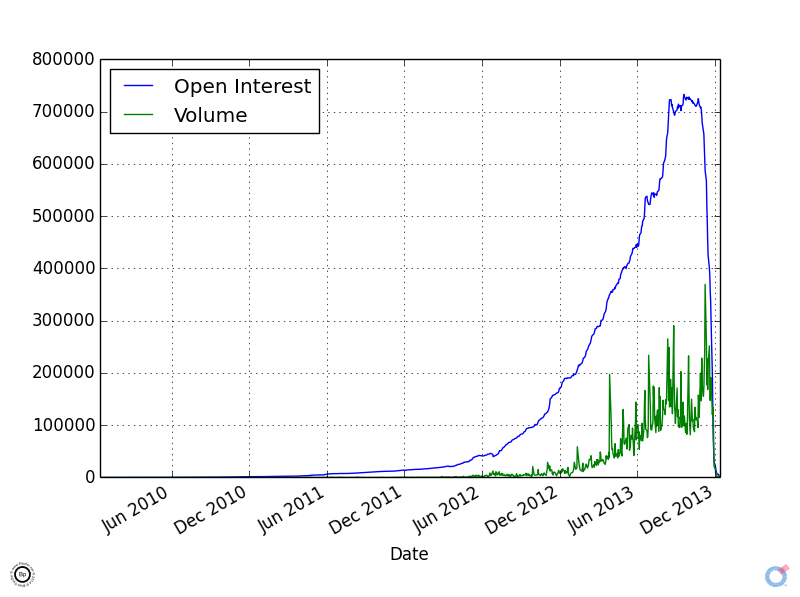
The above graph shows Open Interest and Volume for CZ2013. Note how all the
activity takes place near the end of the issue, in the year it becomes
due.
This
is an interesting metric and either shows the utility of gazing through
a newbie's eyes... or the utter foolishness and futility of doing so.
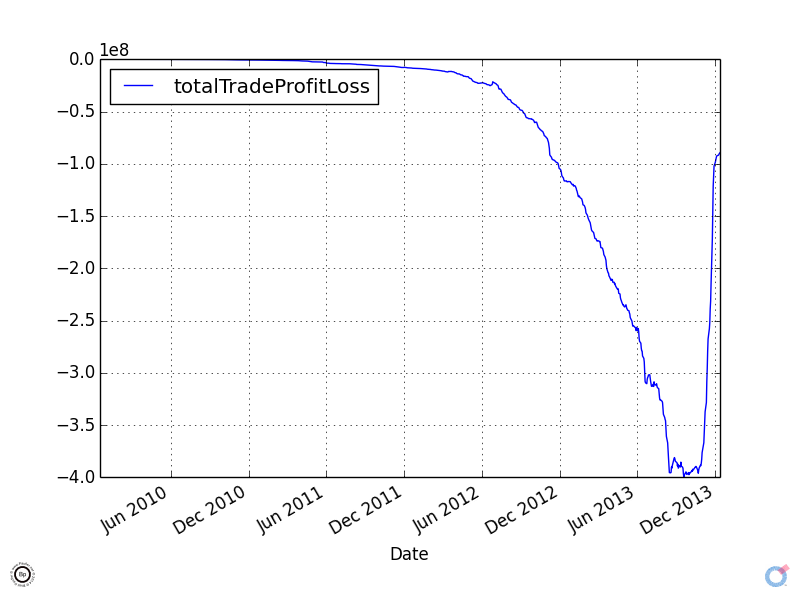
This is the Cumulative Total Profit (or Loss) from trading (all
traders) for CZ2013. If trading were a Zero Sum game, the curve would start
and end at zero. Buy in is negative. Sell out is positive.
Total Loss to all traders for this issue was just shy of
$100,000,000. It sounds like a lot, but it's only about a 1% loss
per trade... or so I figure.
Here are some stats I came up with.
CZ2013 - Across Entire Issue Date Range
Trading Dates = 973
Total Value Traded = +/- $11,500,000,000 ($11.5 Billion)
Average Price Exercised = $490.97
Average Daily Price (over entire issue) = $525.37
CZ2013 - For the Main Trading Year 2013-01-01 to 2013-12-31
Trading Days in the Year = 241
Total Value Traded in the Year = $10.8 Billion
Average Price Exercised on the Year = $484.56
Average Daily Price on the Year = $506.79
And if the Above aren't self explanatory, here's a key:
Trade Dates = Data Points
Total Value Traded = Volume * Ave Daily Price summed over issue or year
Average Price pro-weights the daily prices against volume
Average Daily Price pro-weights every day's average price equally
Um,
yeah. And once again, don't rely on my data and/or analysis for
anything. Really, don't. I had to do all of these
TotalTradeProfit Graphs over, because my algorithm was wrong the first
time around... still might be. And seriously, who knows (certainly not I), what I got wrong last month or will get wrong next month.
Anyhow, let me return you attention to the stats (recapped below from above):
| Entire Issue Average Excise Price | $490.97 |
| Entire Issue Average Daily Price | $525.37 |
| Main Year Average Excise Price | $484.56 |
| Main Year Average Daily Price | $506.79 |
What
this means it that a random marketing program (or at least, one spread
out over the entire trading range) would have outperformed most managed
entrants into the market (on the assumption that the average trade was managed). Of course, there are all sorts of
confounding variables to consider (not least of which being the higher
prices early on), so look at it however you want.
TOTAL TRADING PROFIT
I
thought the Total Trading Profit for CZ2013 as above was a sort of
interesting metric, so I culled together a chart showing the Trading
Profit Issue by Issue, so the below shows one data point for each issue CZ1970 to CZ2013 showing how much money was made or lost trading corn over the entire range of this issue (total of all round trip buy and sells -- or total cost - total sales).
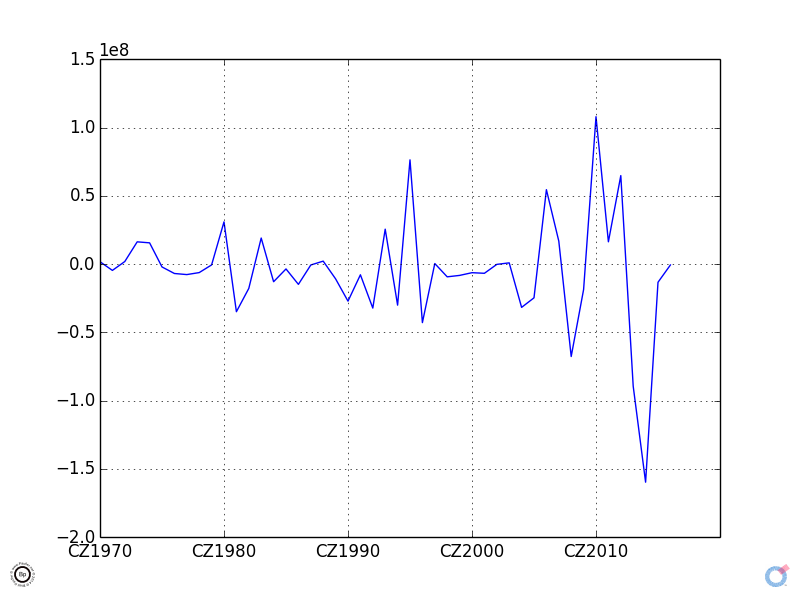
Traders appear to have made the most money on CZ2010, when the combined
profits from all trades (sales - purchases, or more specifically
(-purchases + sales)) came to a total of +/- $108 million.
This is not the total sales price of corn or the market in corn,
but the profit corn speculators and traders made from being in the
market. Over time, one would expect the profit from trading to
tend towards zero, as it the nature of this sort of thing.
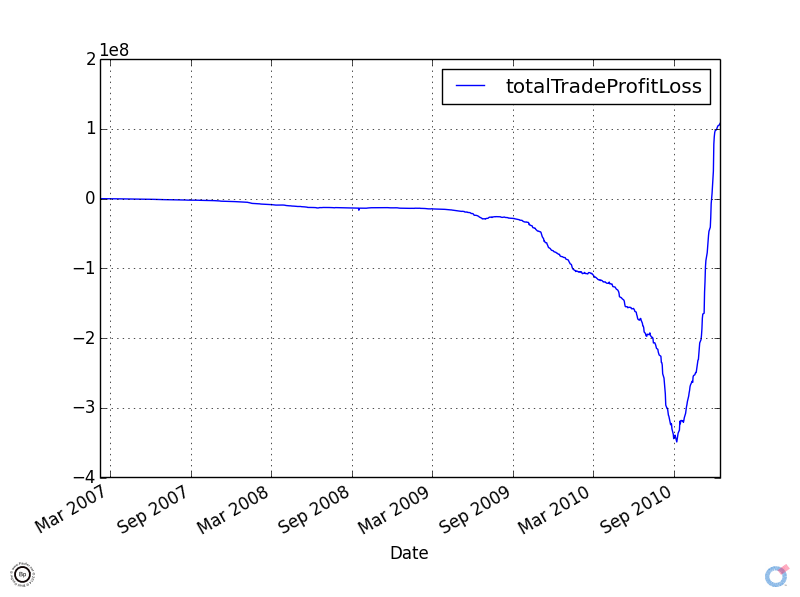
This
is the Total Trading Profit of CZ2010, the issue with the highest total
profit to traders for which I have data. Note, the curve is negative (dips below zero) as
traders buy in, but the buy out price is higher than the buy in, so
eventually (as a group) they made money.
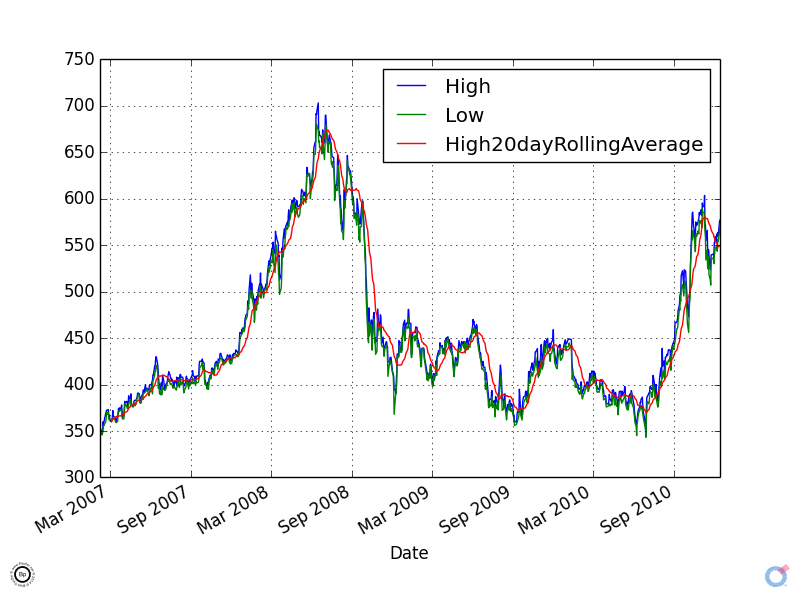
This is the average daily price for CZ2010 (high, low, 20-day rolling average).
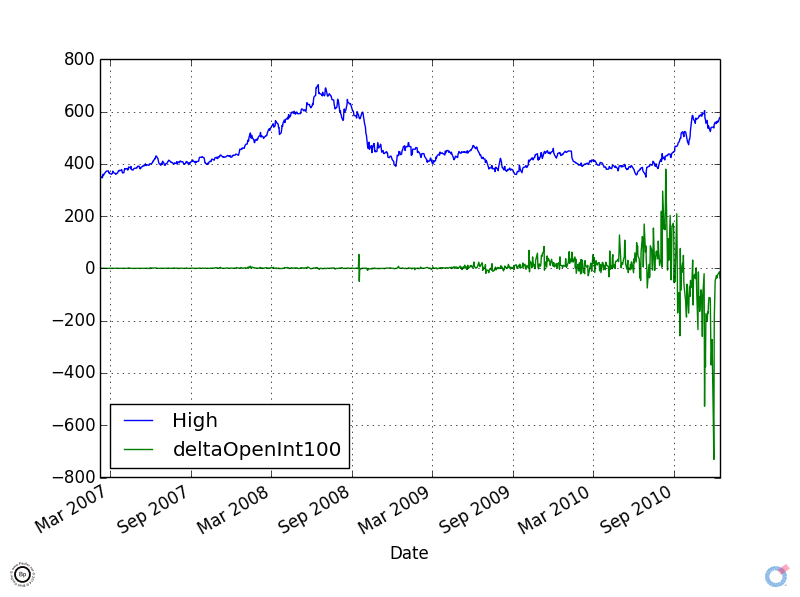
This
is the Daily High Price compared to the relative number of buyers and
sellers (positive = more bought in, negative = more sold out -- it's
the change in long term holding positions). All the activity is
grouped at the end of the issue.
Or if that's not clear, deltaOpenInt100 is 100 times the change in the amount of open interest, which is the same as the Daily Number of Buyers minus Daily Number of Sellers (times 100).
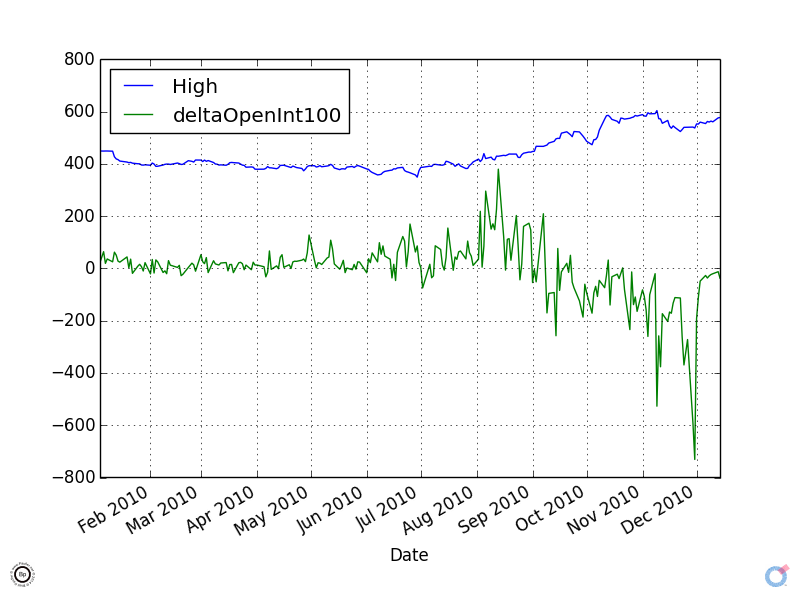
This
is the same as before (Daily High and Change in Position - buy or sell)
but for the year 2010 (so the end portion of the CZ2010 issue, when
it's most active).
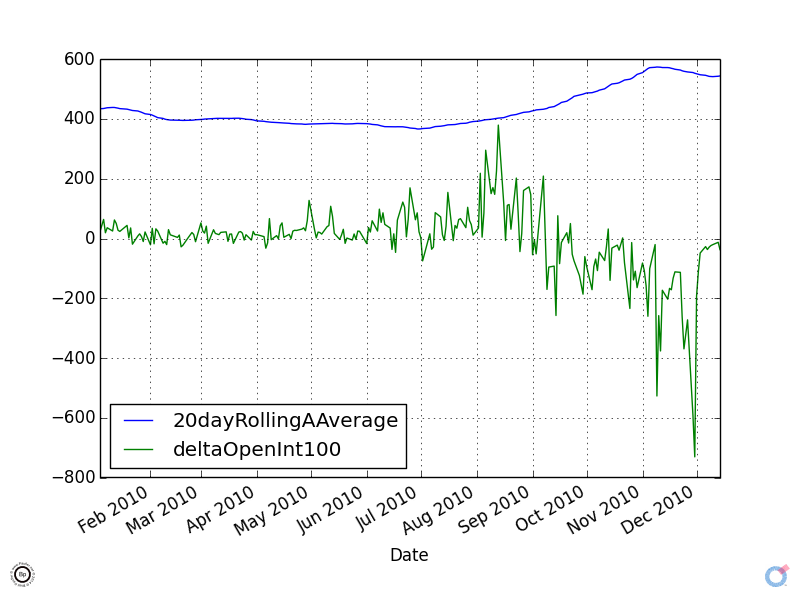
And
in this final graph, we have the Twenty Day Moving Average of the Mean
(High/Low) Price show against the change in Daily Interest. In
Aug/Sep folks were buying into the market at around $400. And
then as the issue came to a close around Nov/Dec they sold out at $500
and more. A 20% profit for a half year in the market. Not
bad. Going back to CZ2013 and we see that the opposite thing
happened, so speculators lost money overall.