not to be taken seriously fact and fiction are
mixed at my fancy do not rely on any
'information' contained on this site complete terms and disclaimer at these links
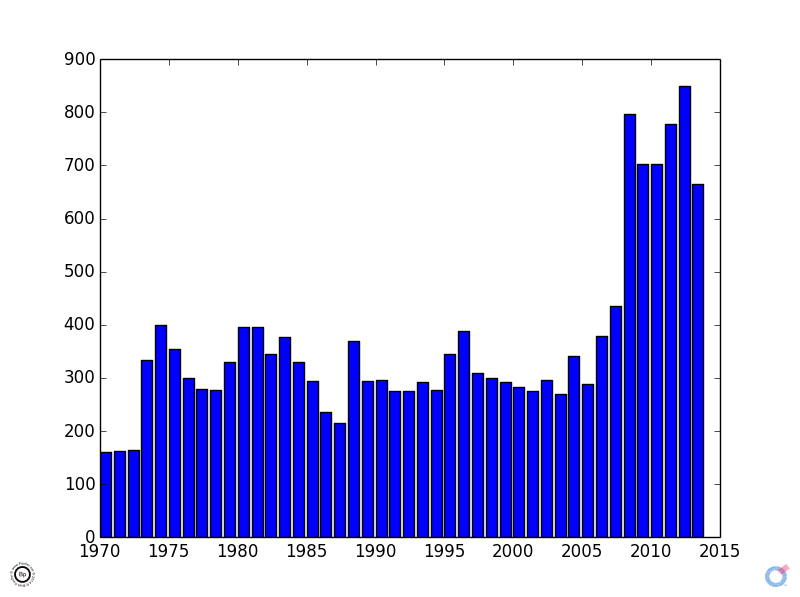
Data is probably inaccurate. But it's intended to track the corn future issues CZ1970 to CZ2013. Use at own risk.
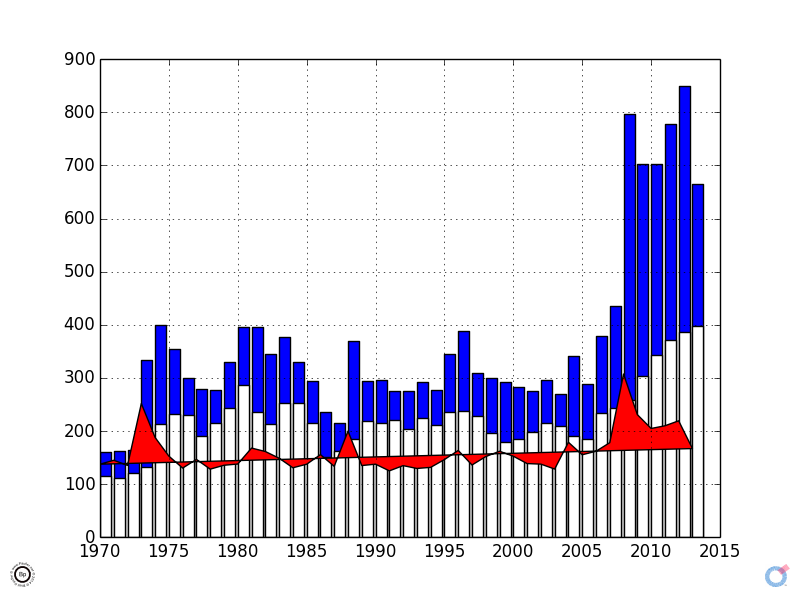
High Bid Price For Each Issue
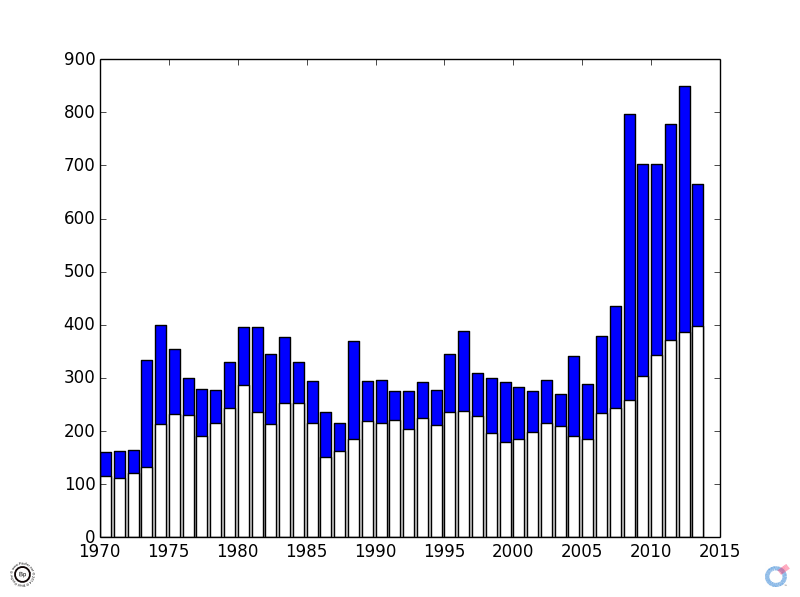
Low Bid Price Added, so the Blue represents the trading range
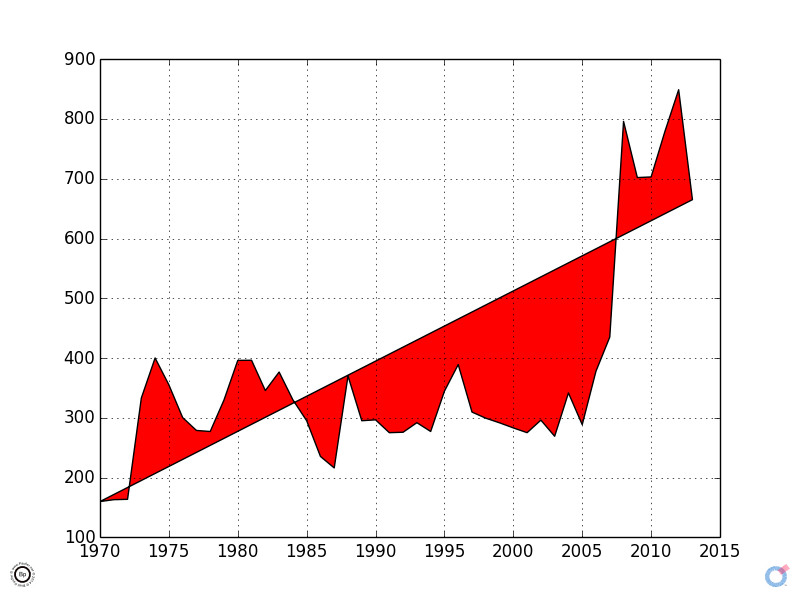
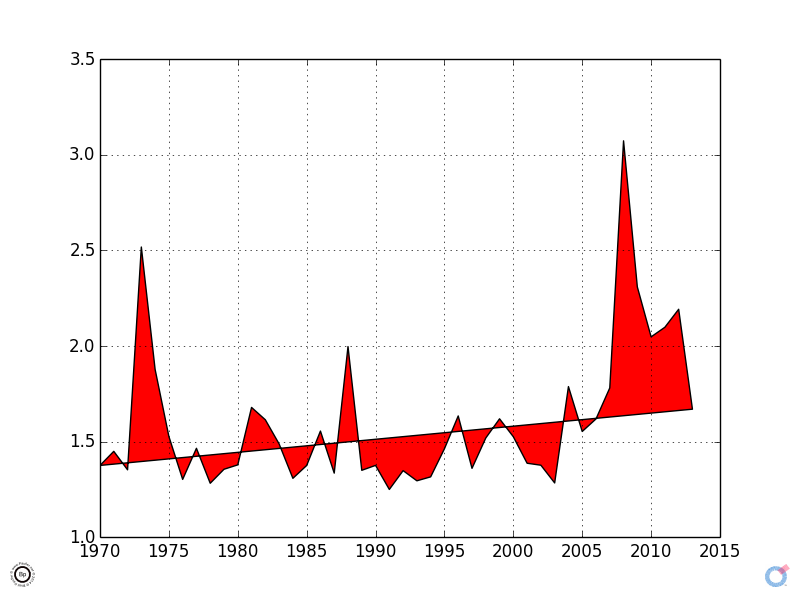
This is a 'Fill' graph of the High Sell price (next image explains what this is better by contrast).
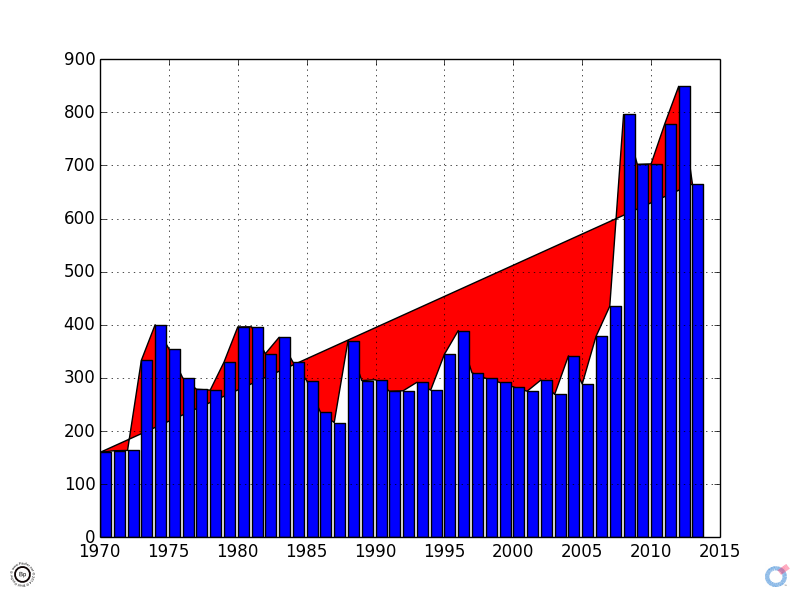
High Bid Price - Fill Graph overlaid on top of a bar graph. Notice the trend line.
I'm
calling this the Fractional Average (a made up name, so perhaps giving
an indication as to the spuriousness of this metric). It's the
high price of any issue (which is different from the high price per
year as many of the issues span multiple years) divided by the low
price of the issue. To my mind (and I could be wrong -- about
anything on this site, but especially 'facts' like this), this
represents the factor of spread between the low and high.
Or to
put it much simpler, the trend line indicates a 50% premium available
historically for 'ideal' marketing, with spikes of up to 300% available
in the recent past. Which means, if:
Farmer A Sold on the Best Date Farmer B Sold on the Worst Date Farmer A would make on average 50-300% more on his crops than Farmer B.
It's idealized. It's conceptual. But this would be the Holy Grail that Marketing Programs are Chasing.
The
scale is all messed up on this graph, but it overlays High/Low price
with the Fractional Average perhaps making it clearer (after the fact,
at least) when the big money gains (spreads) are to be found. The
red part graphs the ratio of the Blue to the White. (Fraction
Average = High / Low)
That's all for this month. Mr GigglesWorth is now taking request for basis of next month's graphs.
Perhaps
I'll look at the Daily Weighted Average Price and compare that to the
High and Low if nothing else sounds interesting. The Daily
Weighted Average Price would provide a Performance Benchmark (even
trades daily across the year) to compare with results of any Market
Timing (i.e. managed) Marketing Program.