not to be taken seriously fact and fiction are
mixed at my fancy do not rely on any
'information' contained on this site complete terms and disclaimer at these links
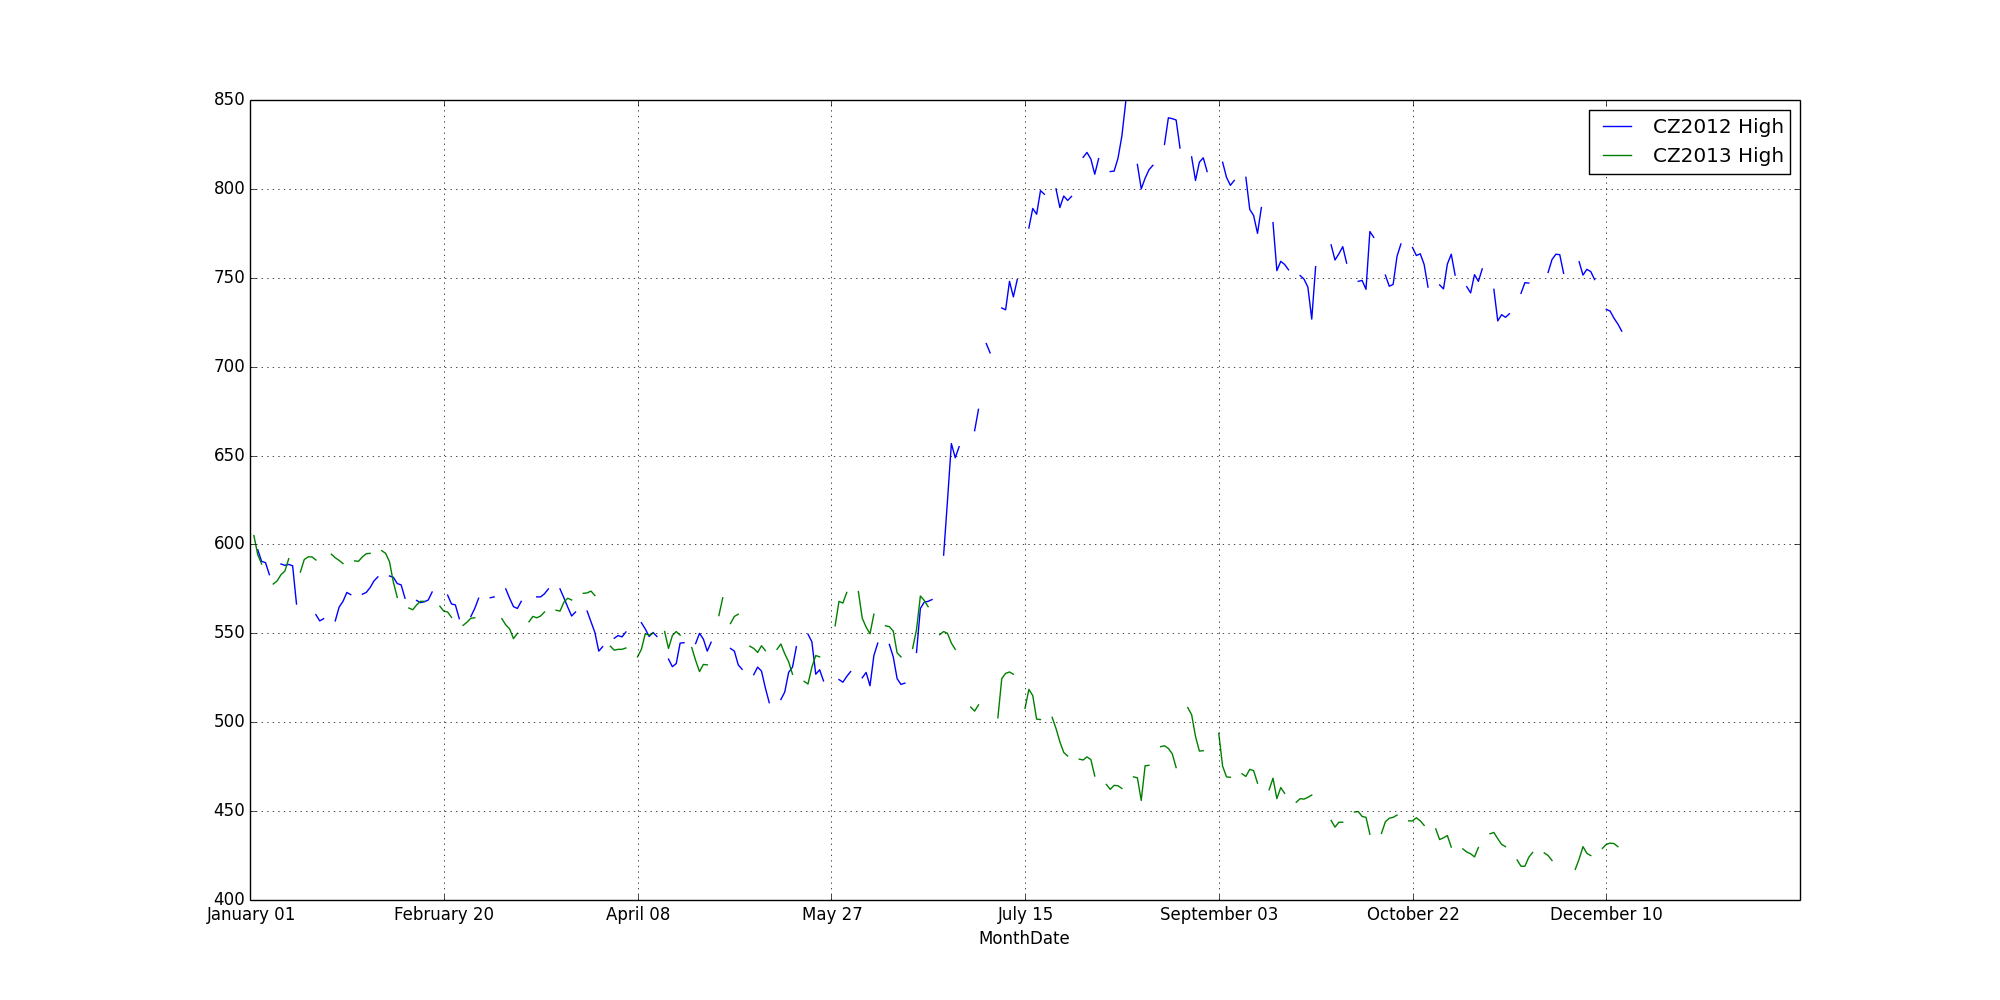
Layer graphs showing CZ2012 and CZ2013 were requested. All graphs show
price on the vertical axis per futures contract and relative day of the
year across the horizontal axis as the bottom.
The above is a graph of the raw data. Breaks in graph are
because the trading days do not line up from one year to the next
evenly. There are, of course, other ways of doing this so they do, but
I didn't...
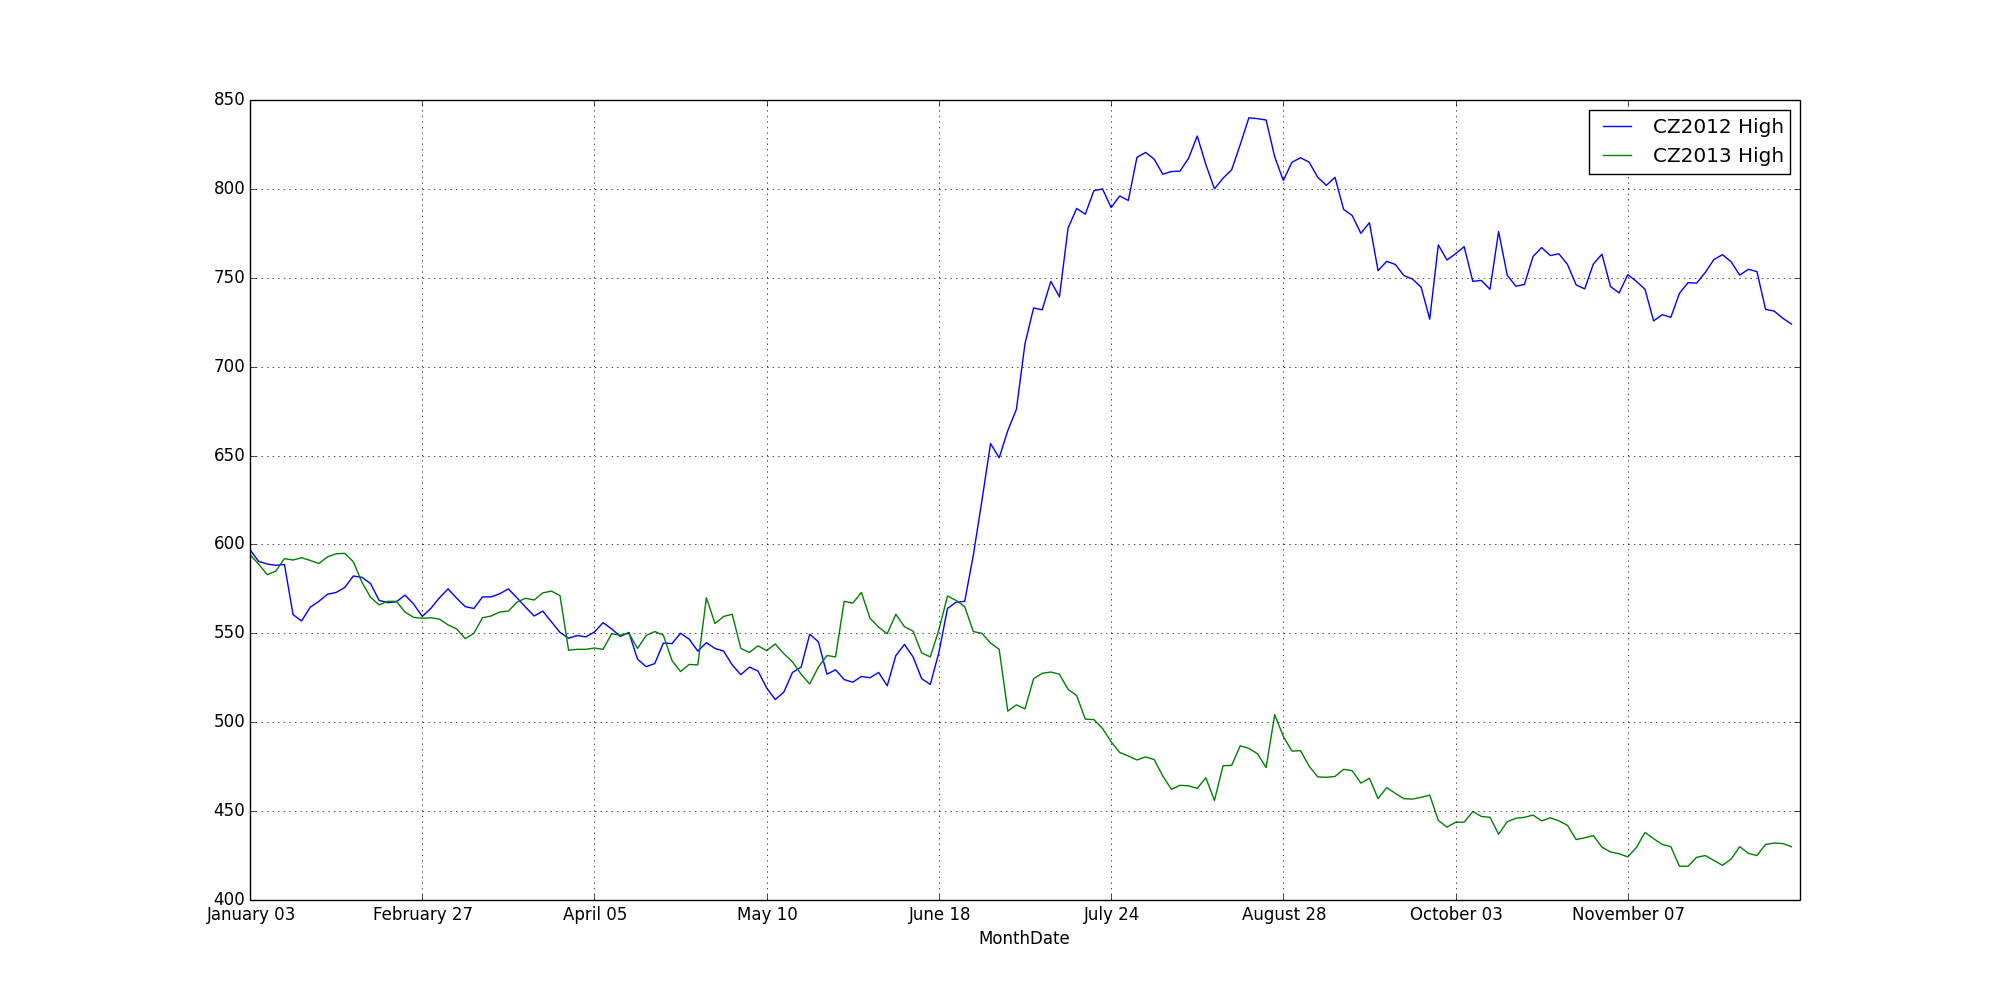
This is a graph showing only the points that line up, trading dates
for both years that land on the same date. It is a smoother graph and
not much information is lost when only two years are layered.
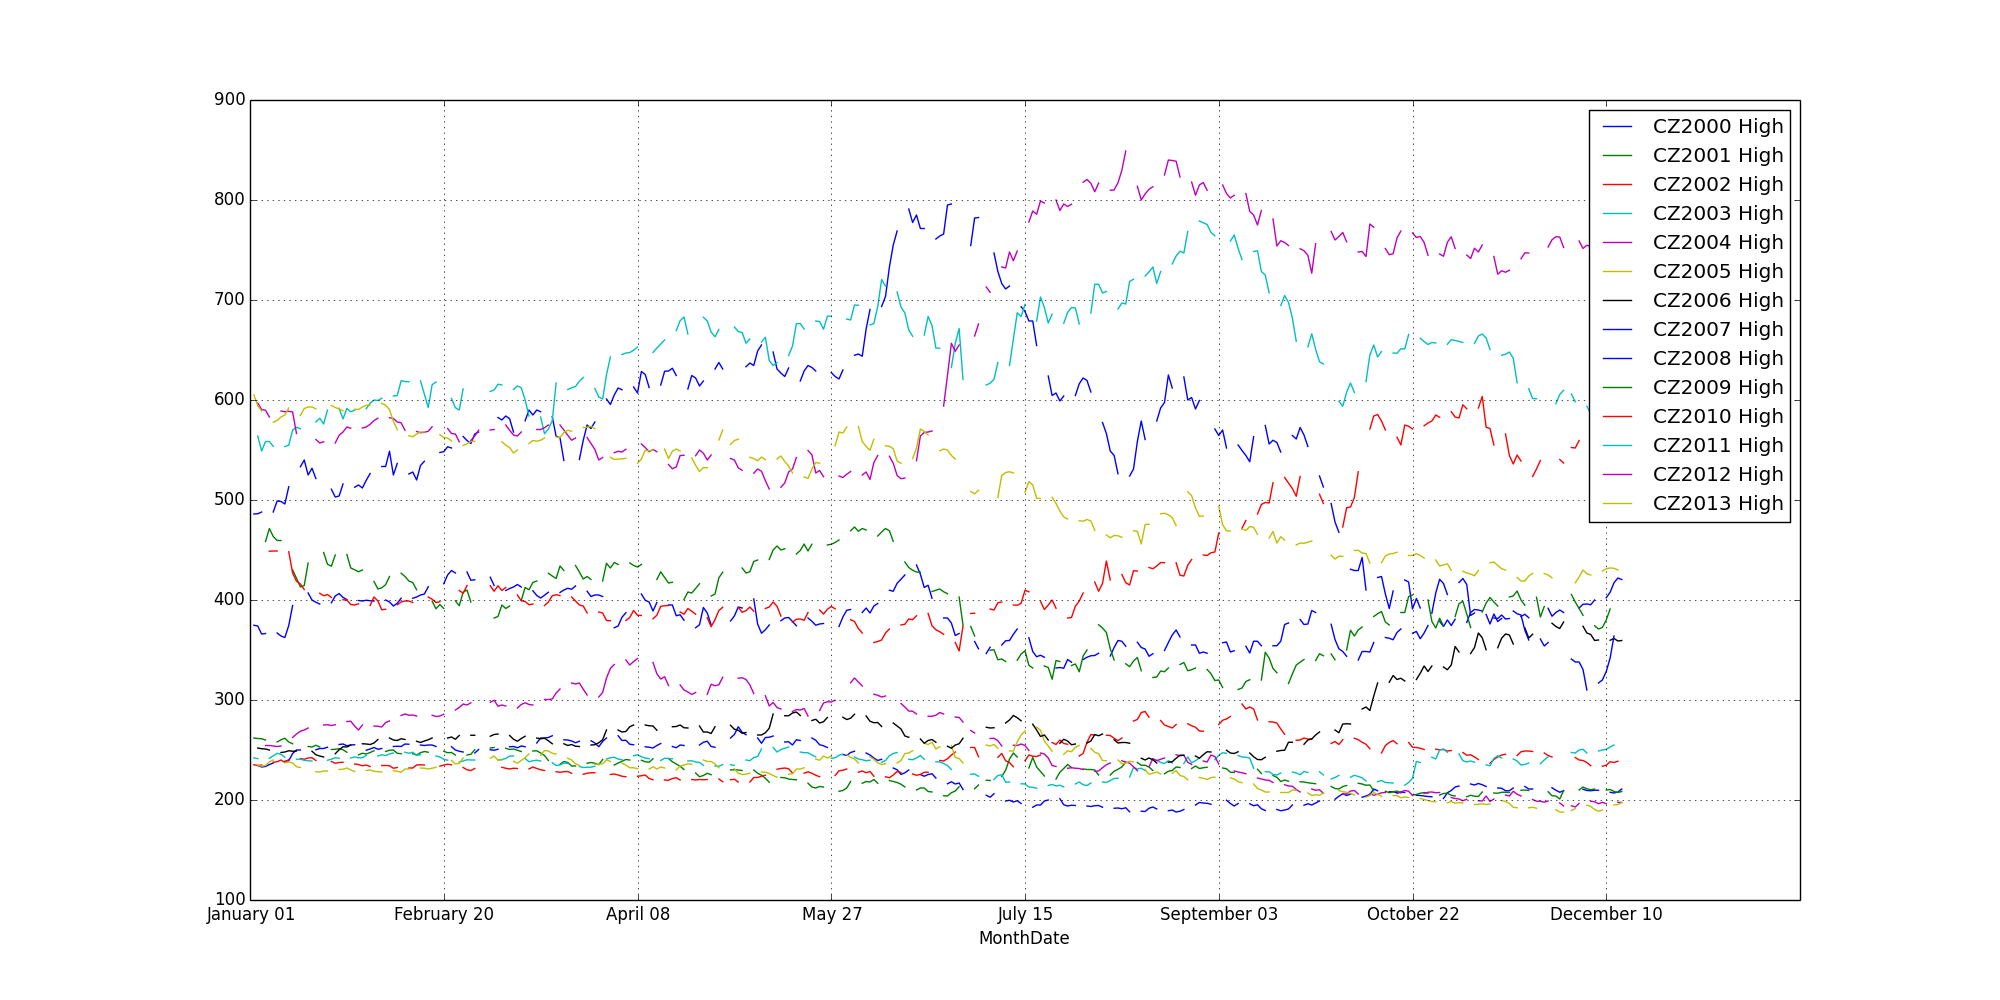
This is perhaps more of a proof of concept that my graphing program
is working that anything that conveys information. Information for
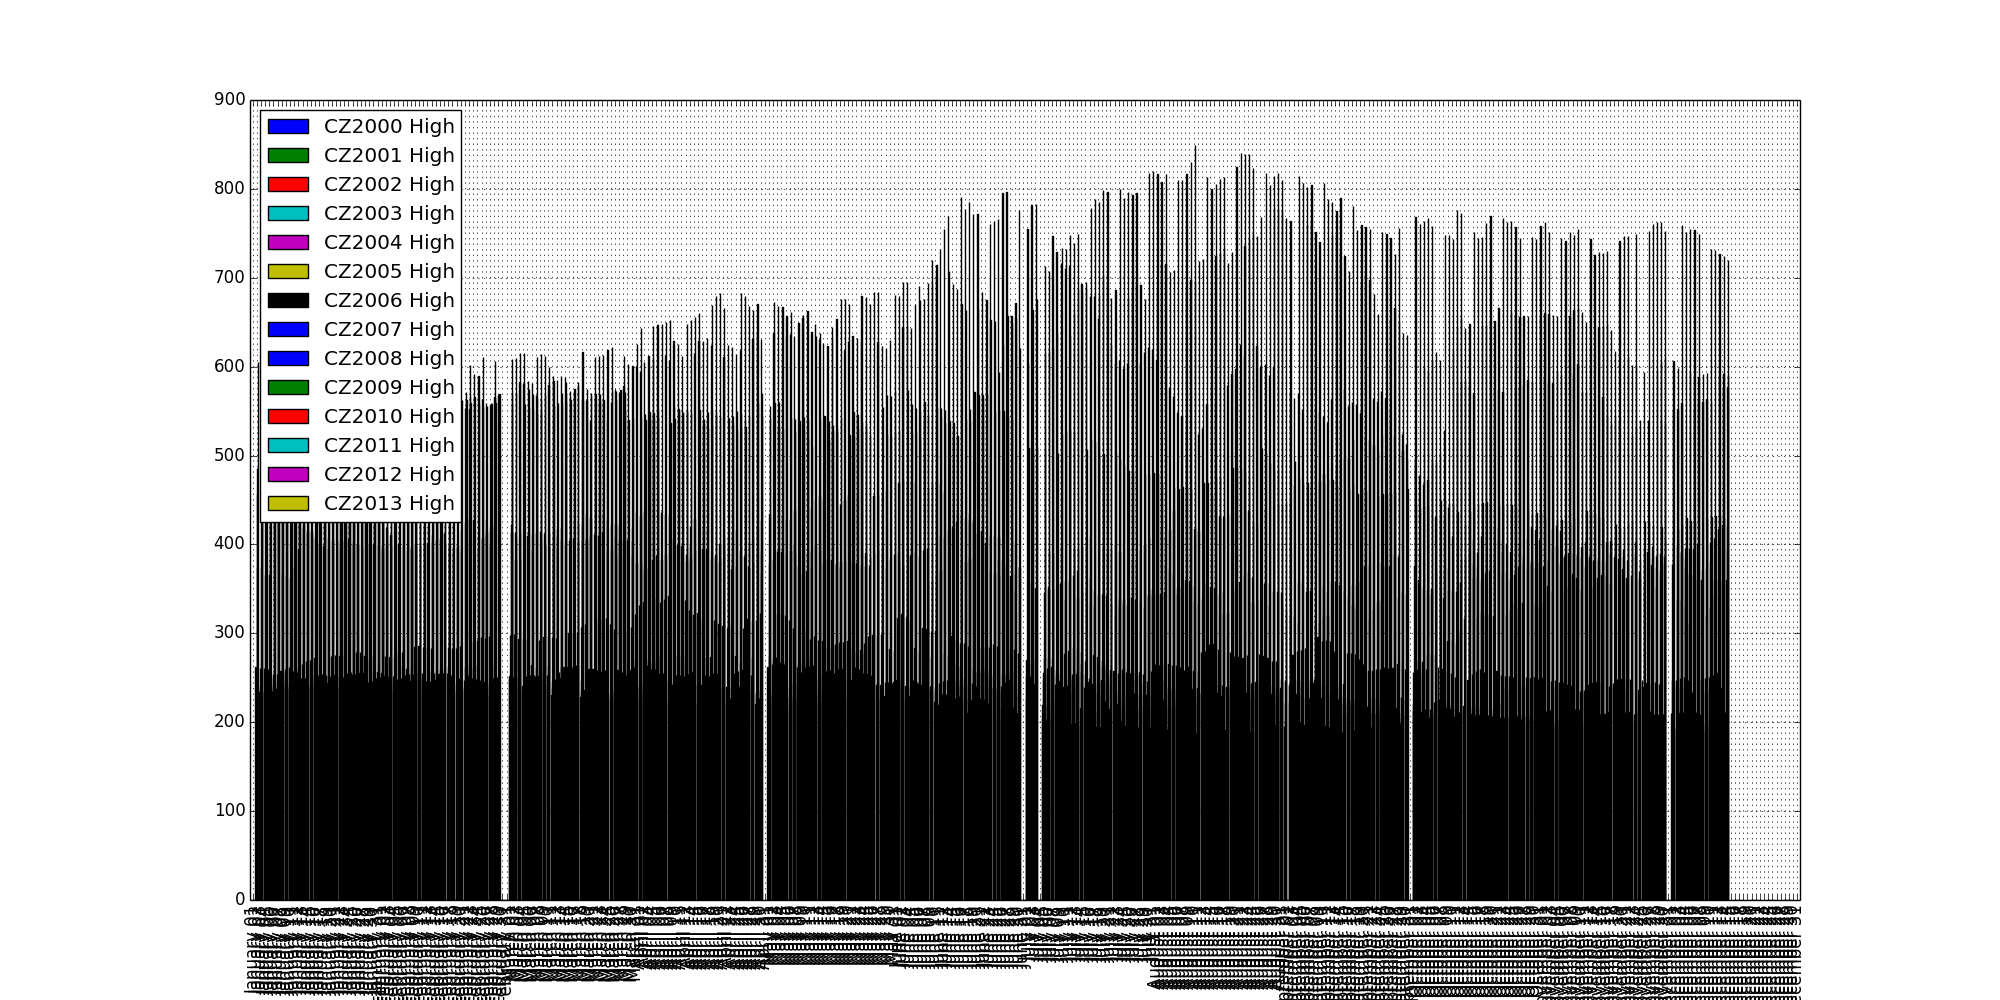
CZ2000 to CZ2013 are stacked.
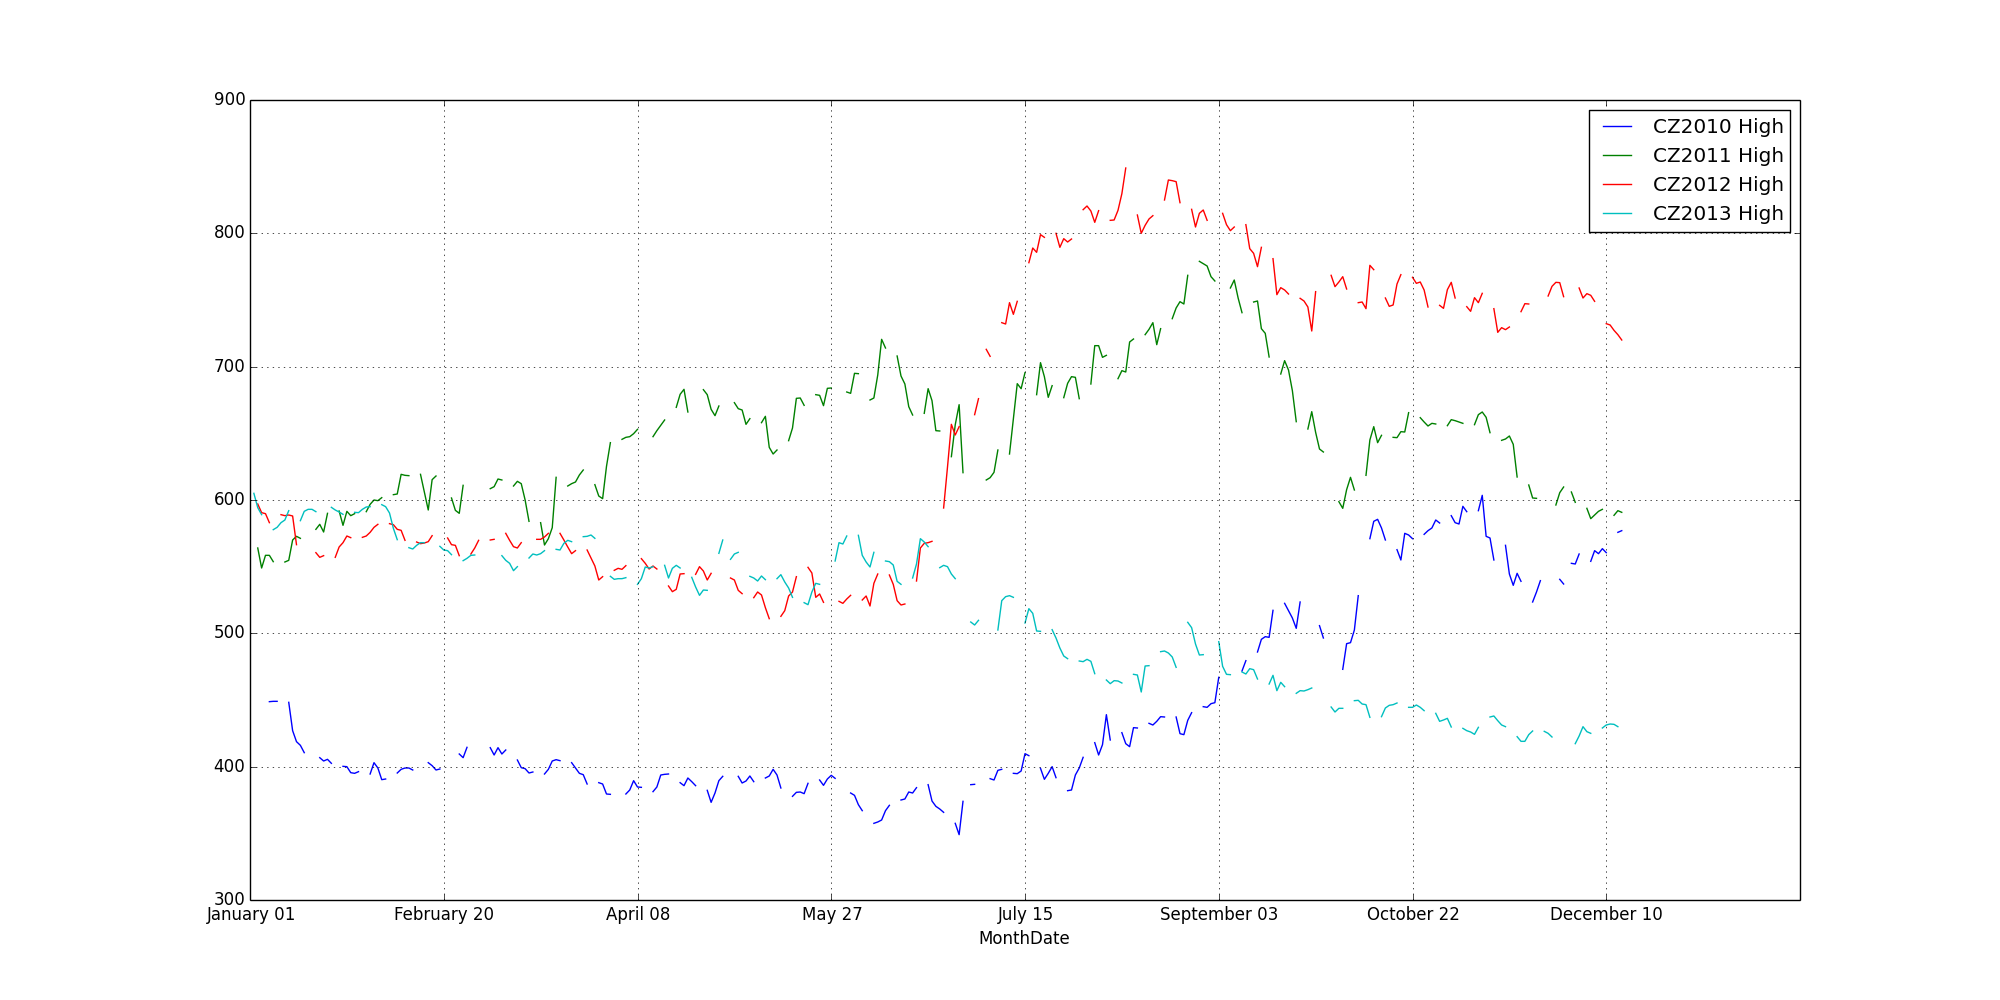
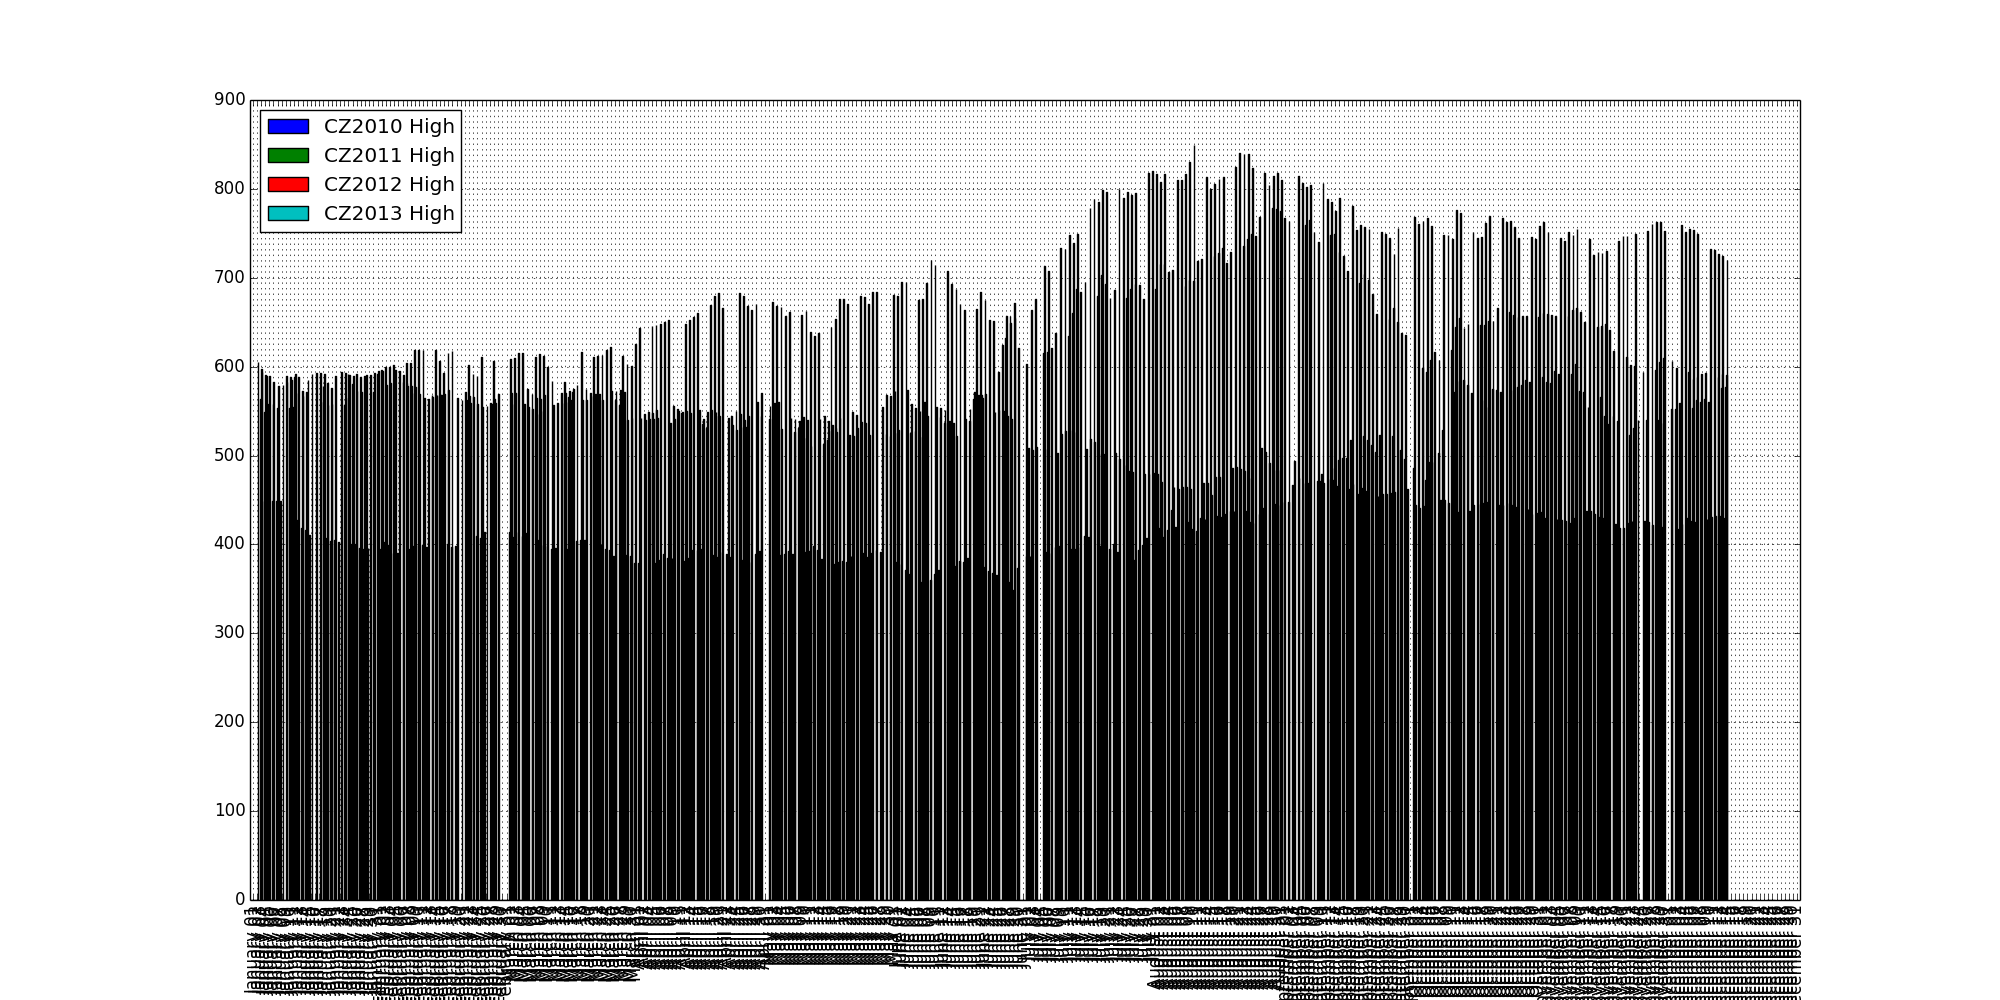
This is the data for four years: CZ2010 to CZ2013. Each line
segment represents a trading week. By it's nature, the graphing program
smooths out the lines.
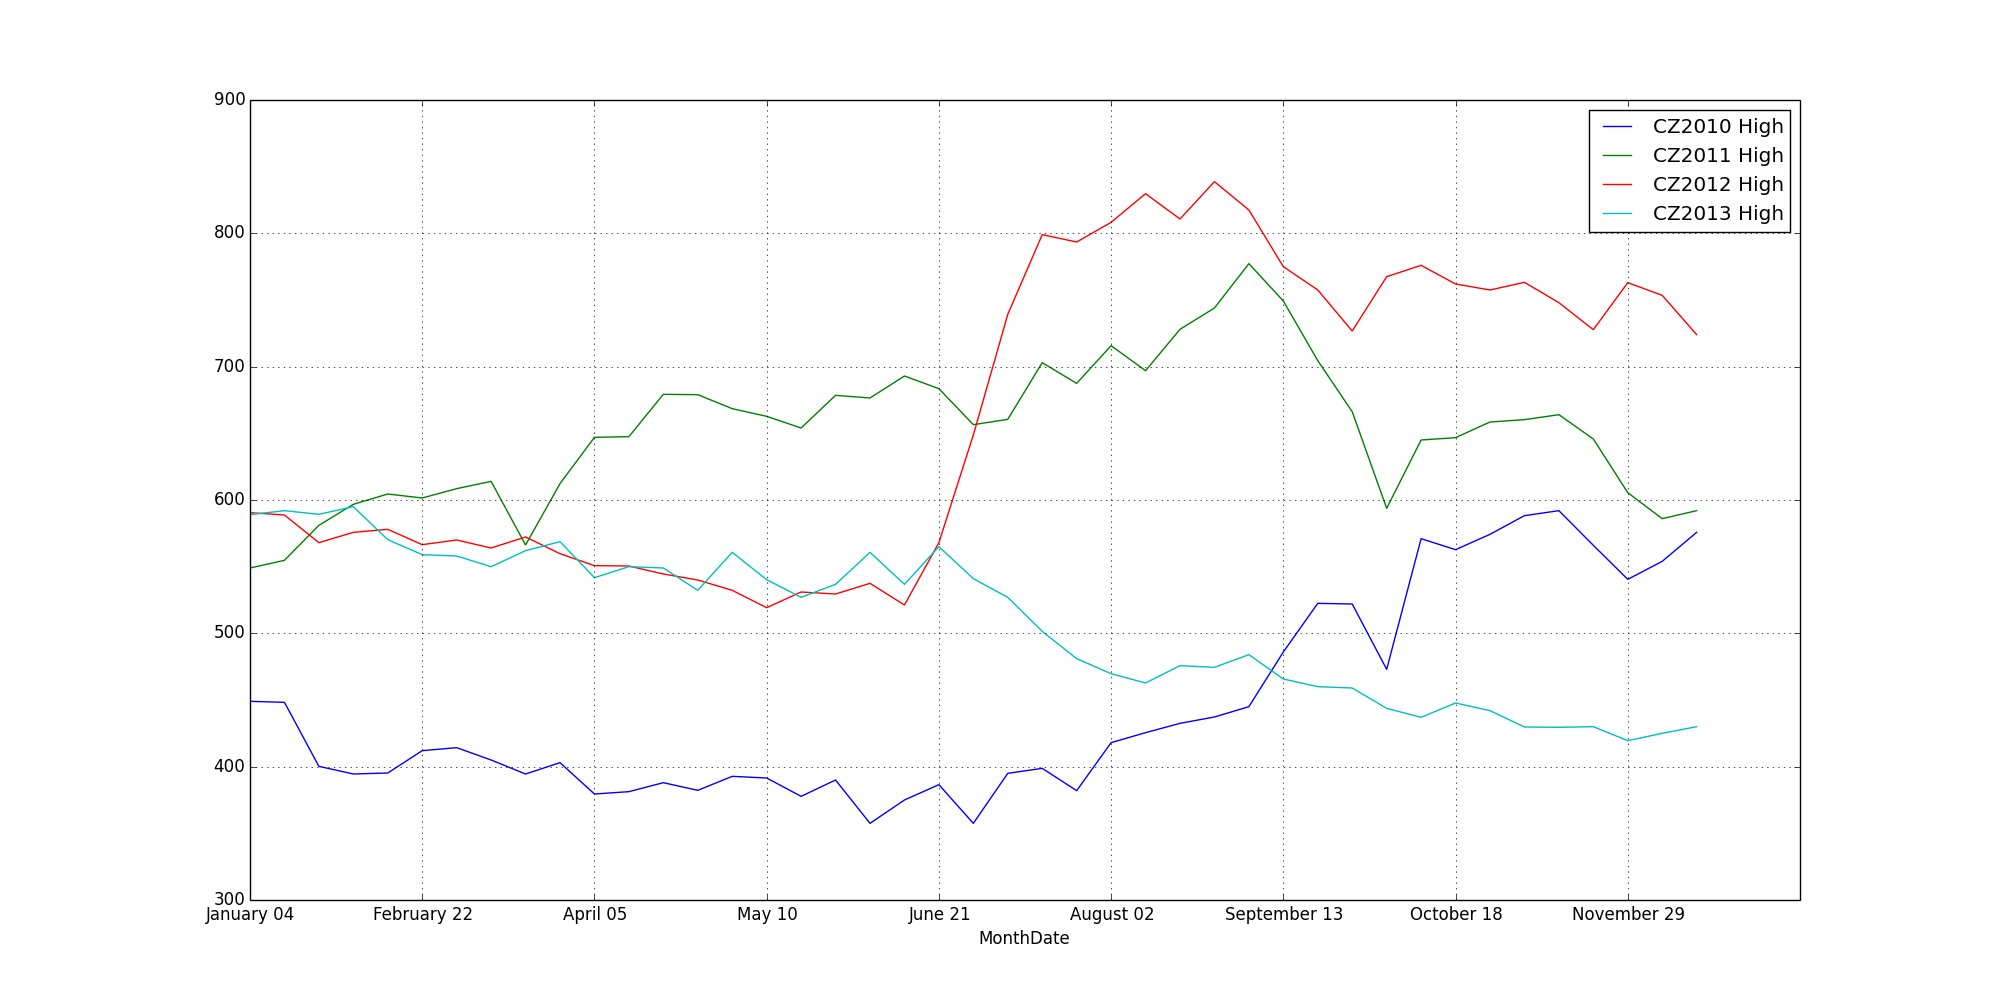
This is CZ2010 through CZ2013, as well. All the lines crunched
together: meaning, any date that didn't have data for all four years
was deleted from the dataset prior to graphing. It's doubtful much
information was lost at this scale. There were around a hundred data
points still in the set.
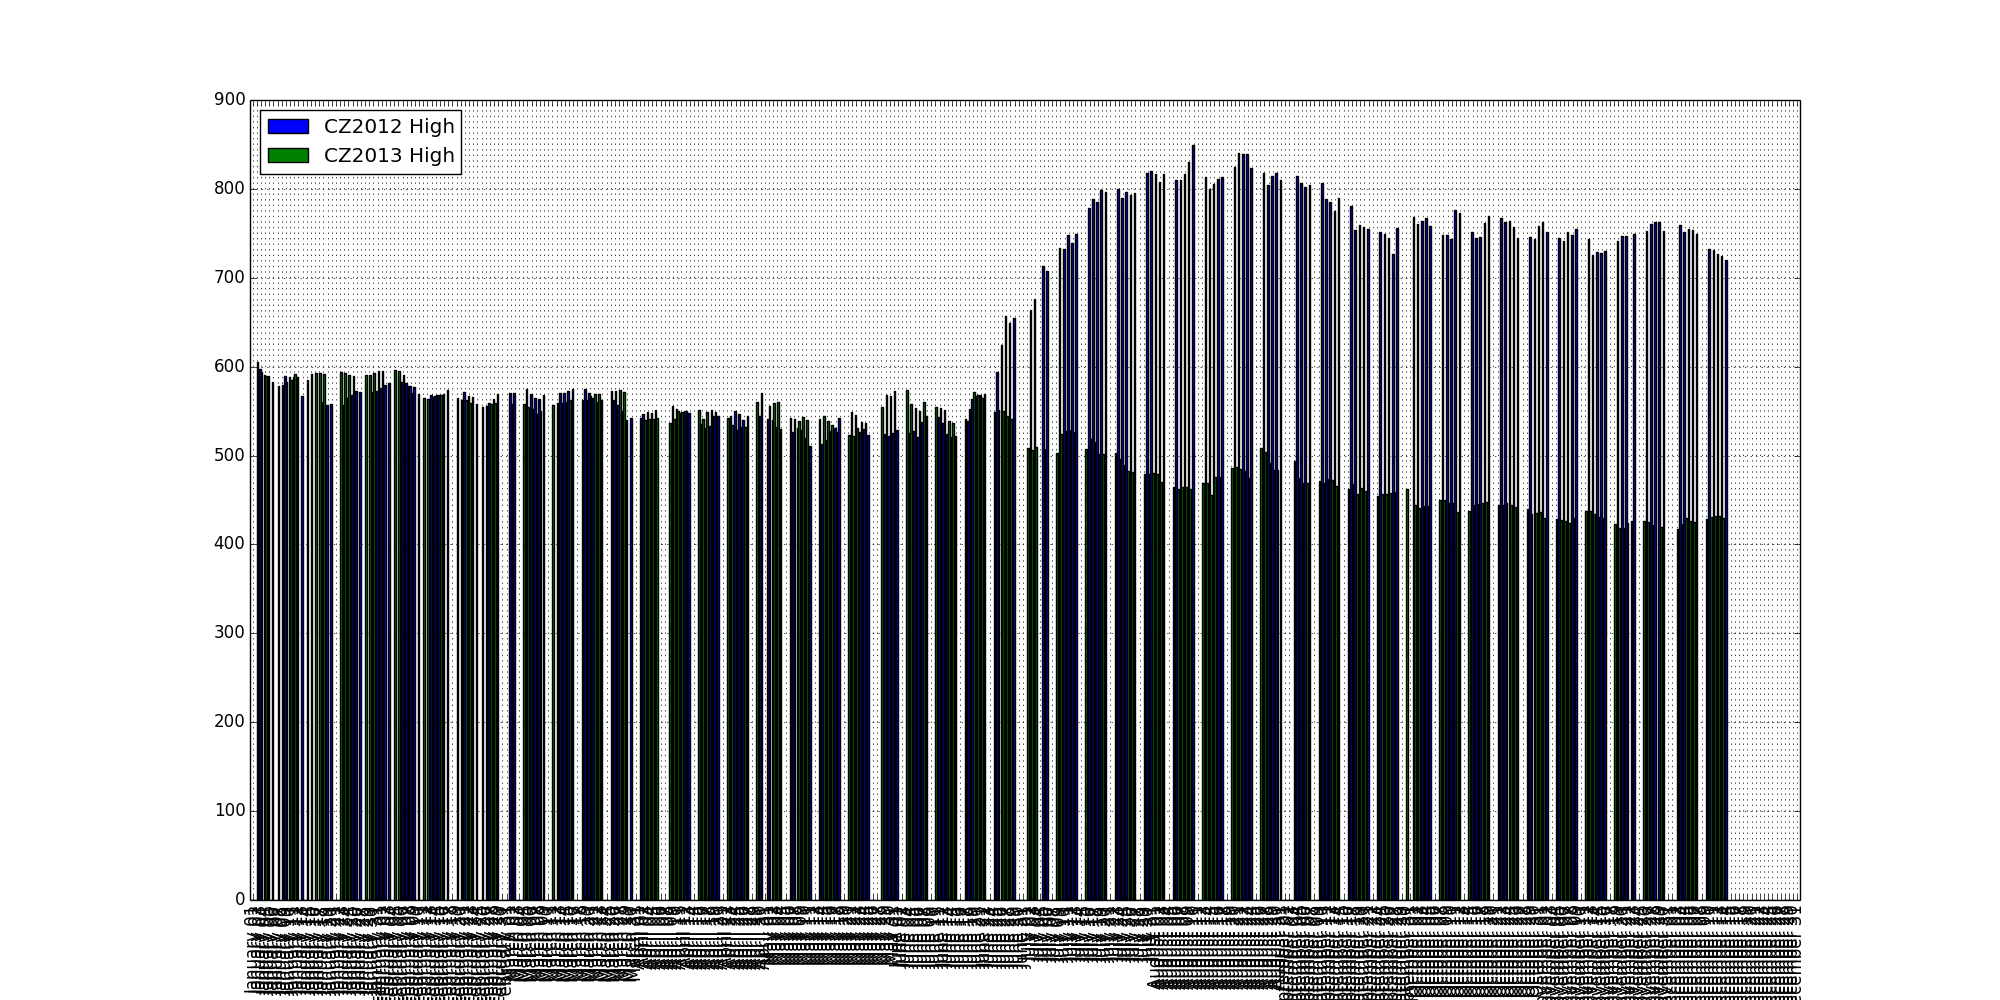
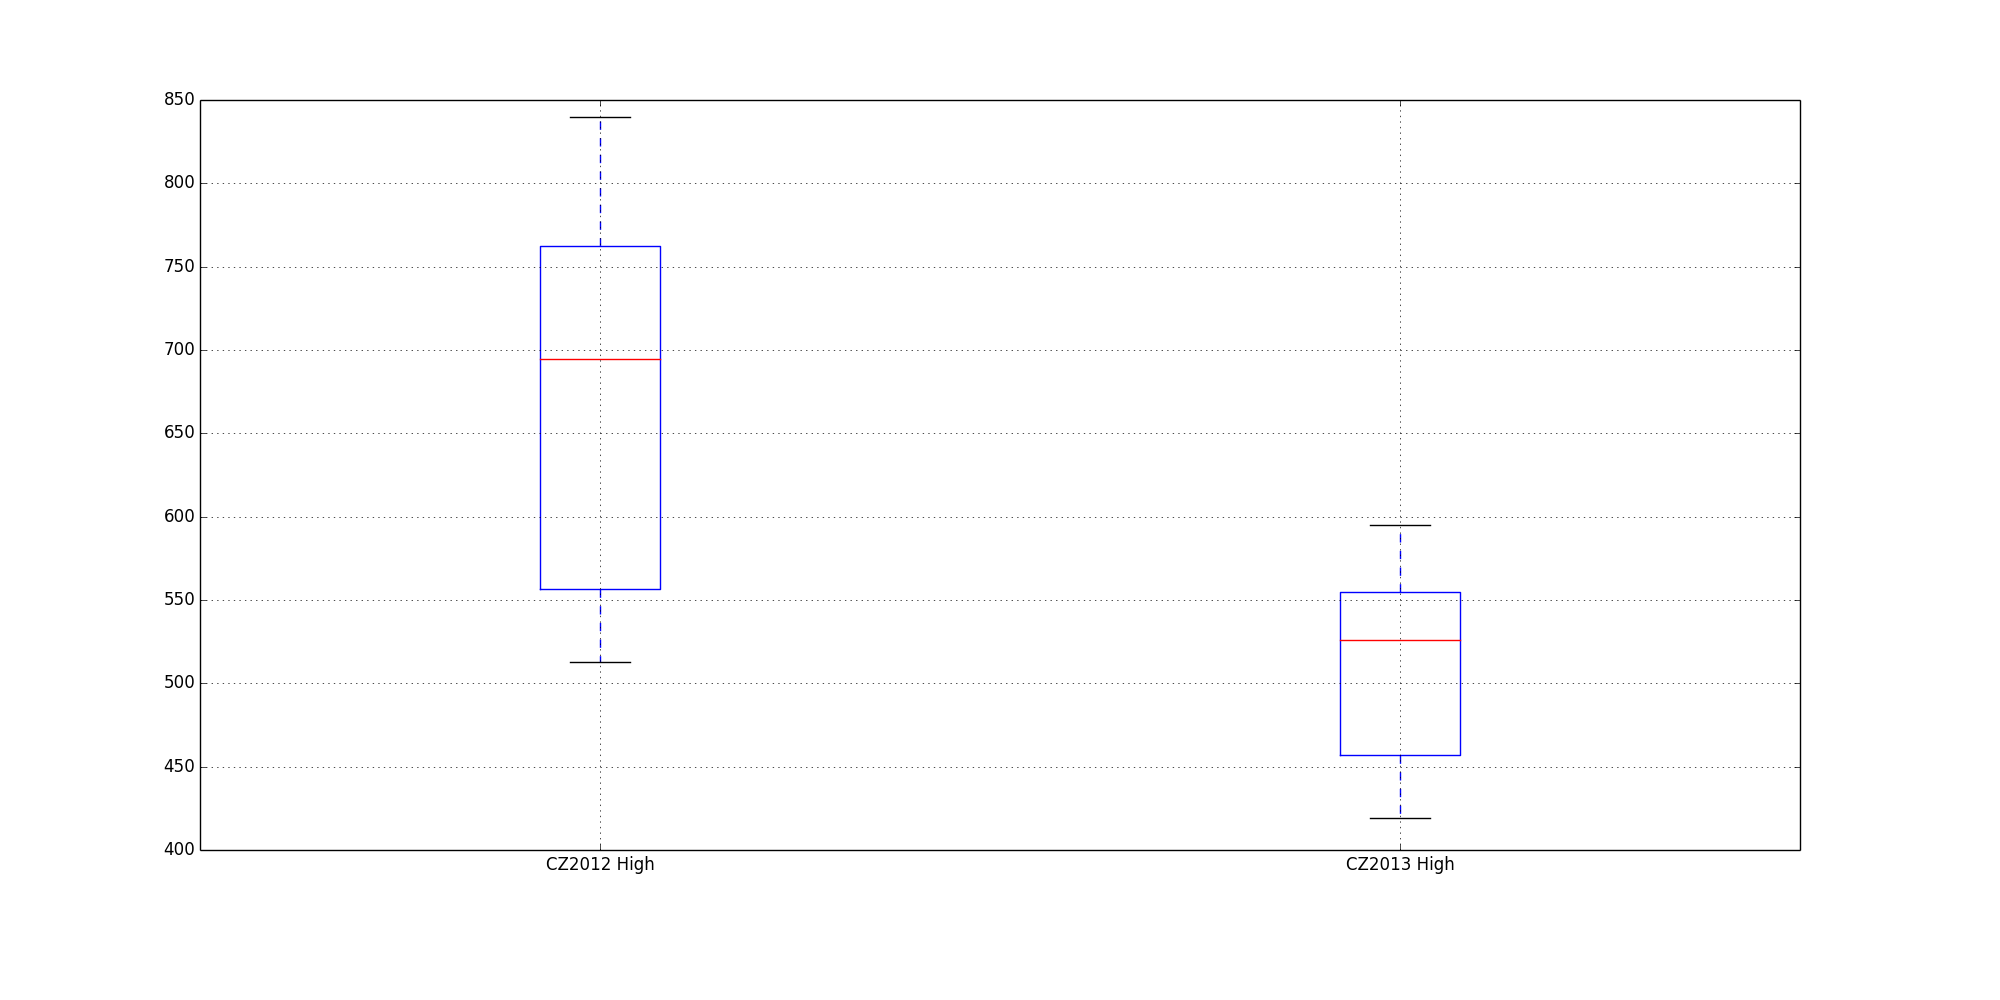
This is a bar graph for CZ2012 and CZ2013. I don't think it provides much information.
This is for CZ2000 to CZ2013. It provides even less information that the above.
A graph of CZ2010 to CZ2013, which includes all the days of the year -- and then some. I include it to contrast with the next.
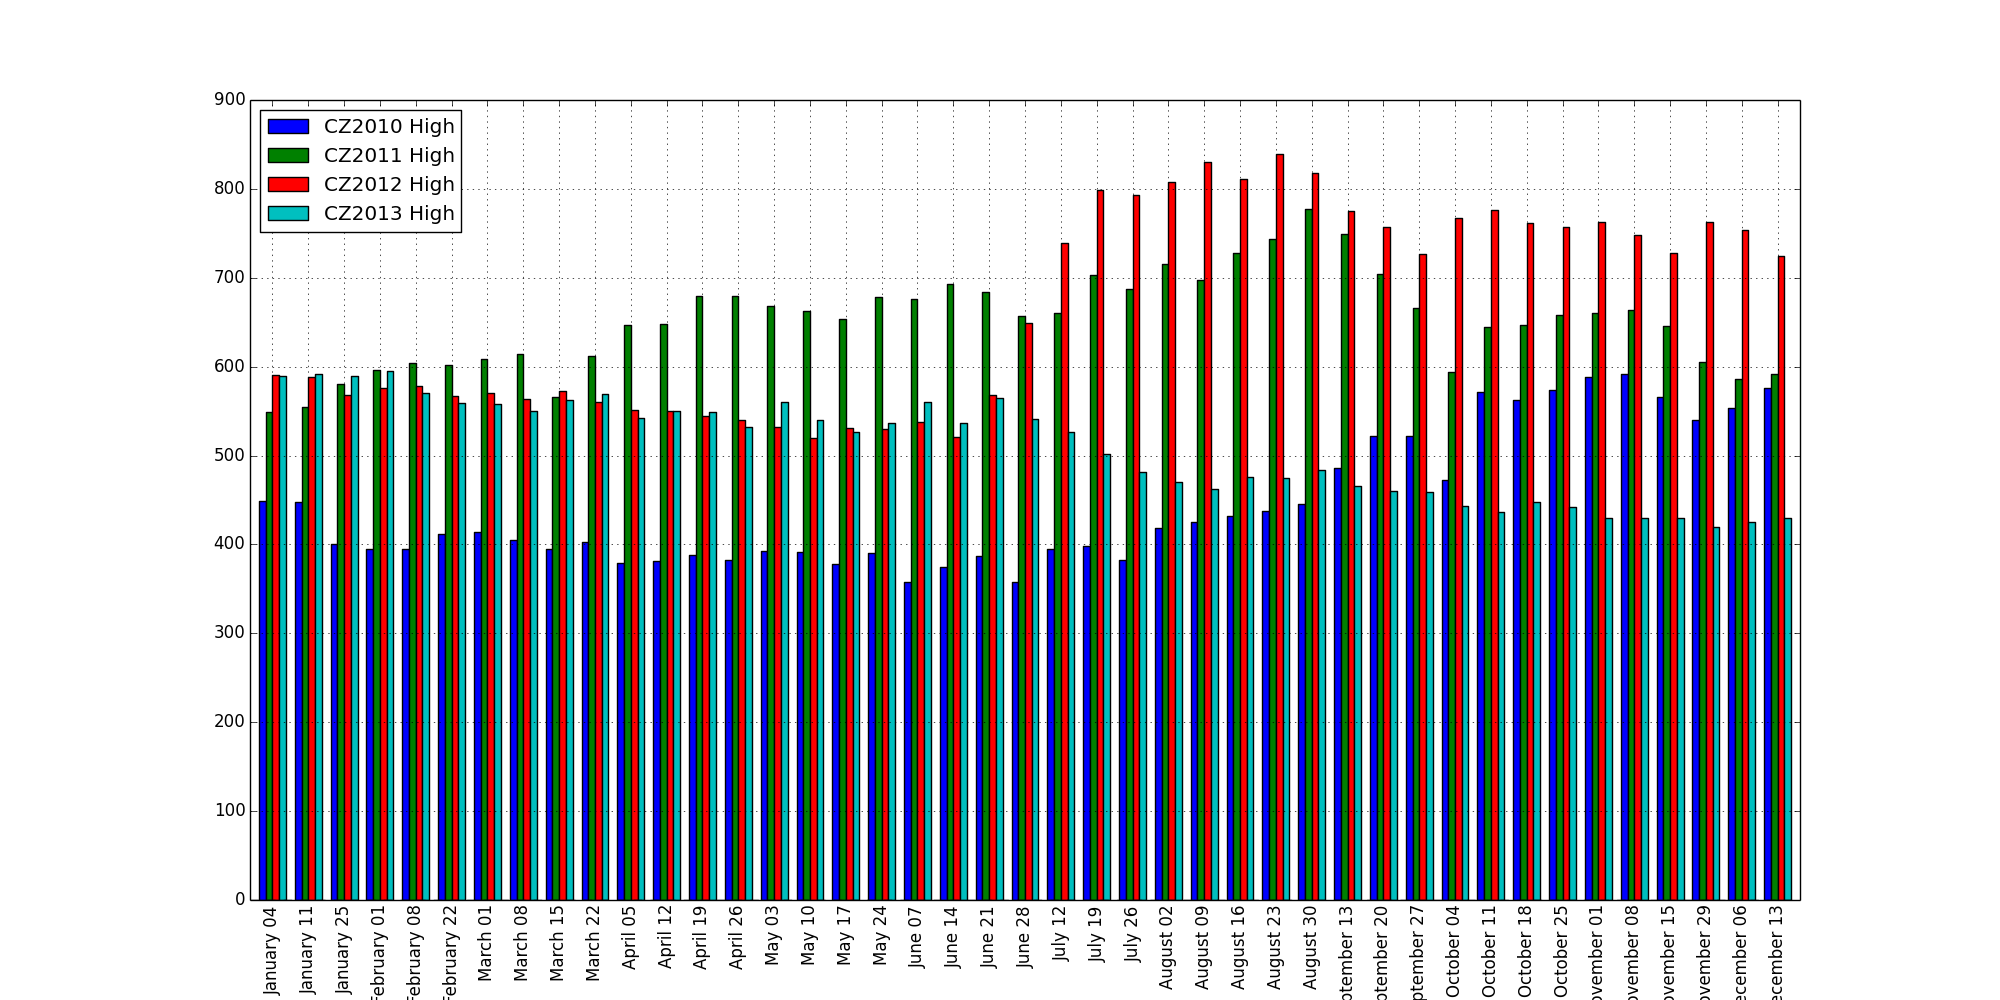
I still wouldn't spend too much time staring at this. But it is a
lot easier on the eyes than the one above. It is missing quite a few
data points, bringing the plotting function back down closer to
something the graphing program can handle with style and grace.
There is not much difference between these two. Both are CZ2012 and
CZ2013. Top includes all data points. The bottom only the overlapping.
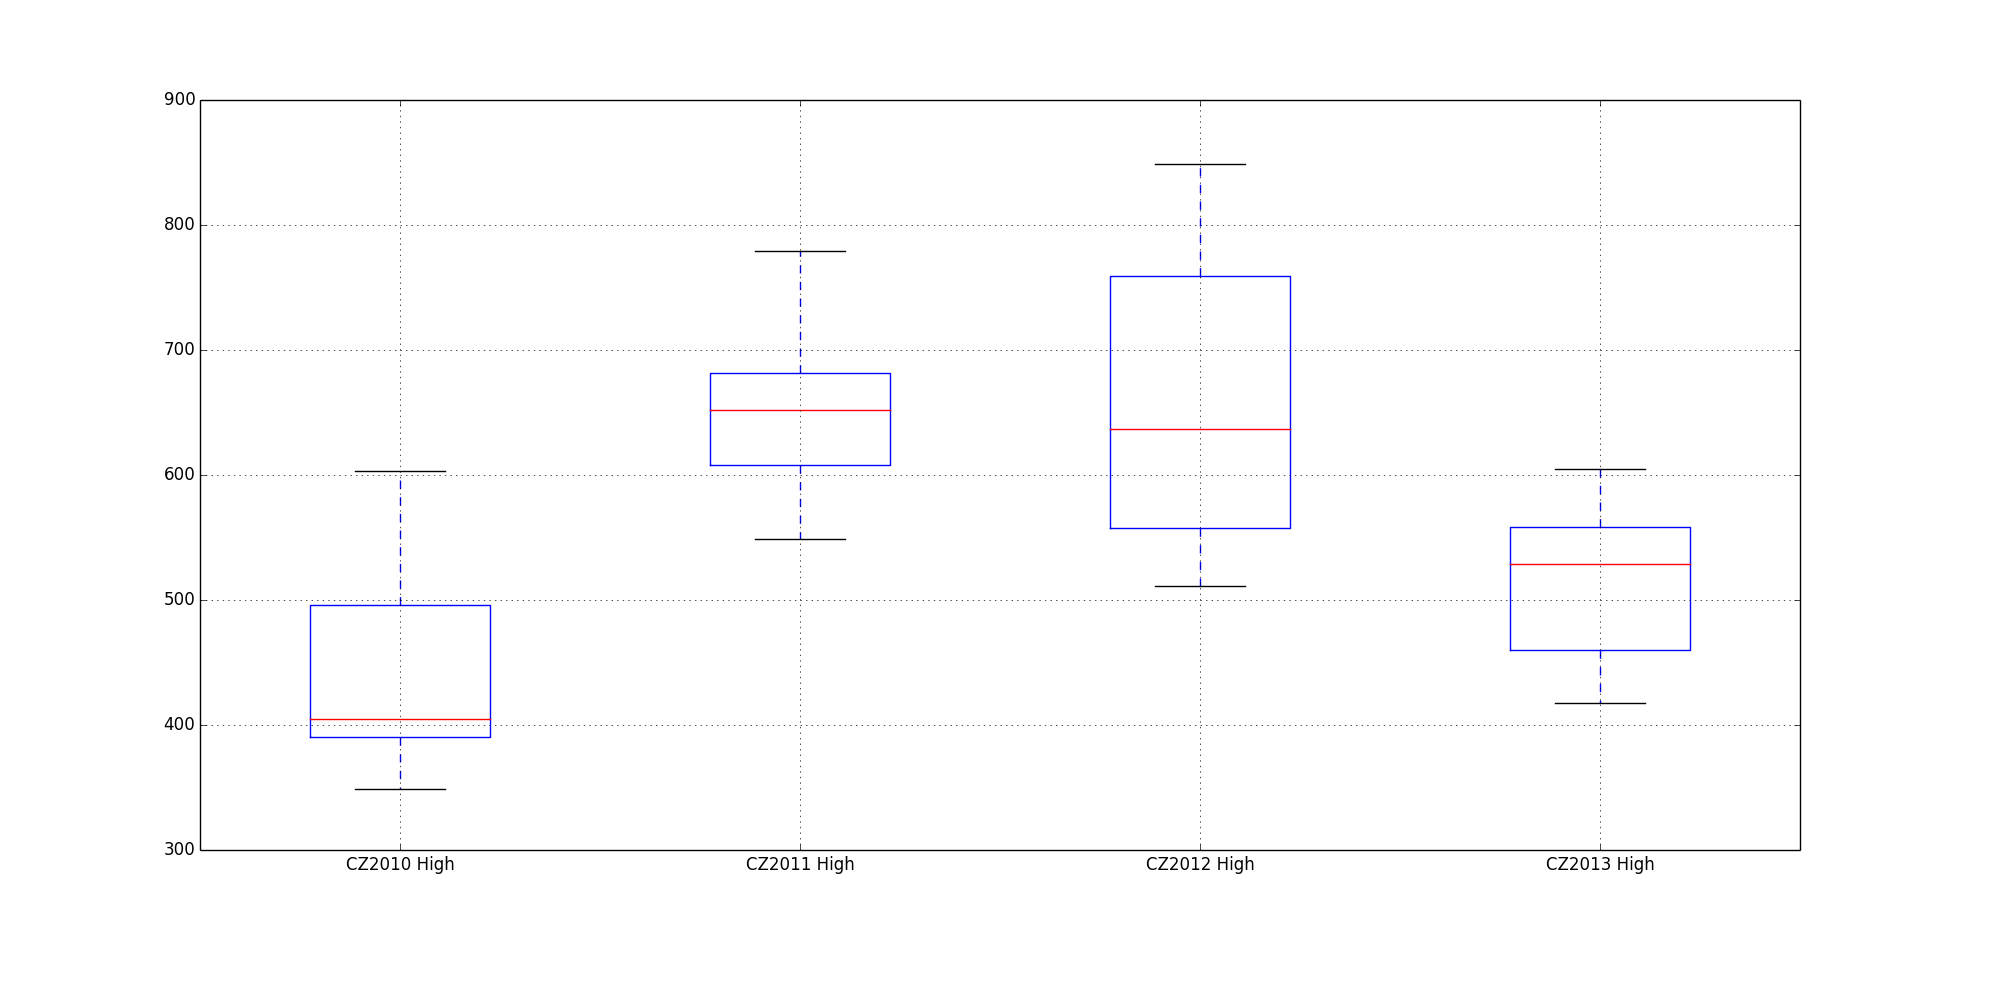
The next set of data differs more between the two versions.
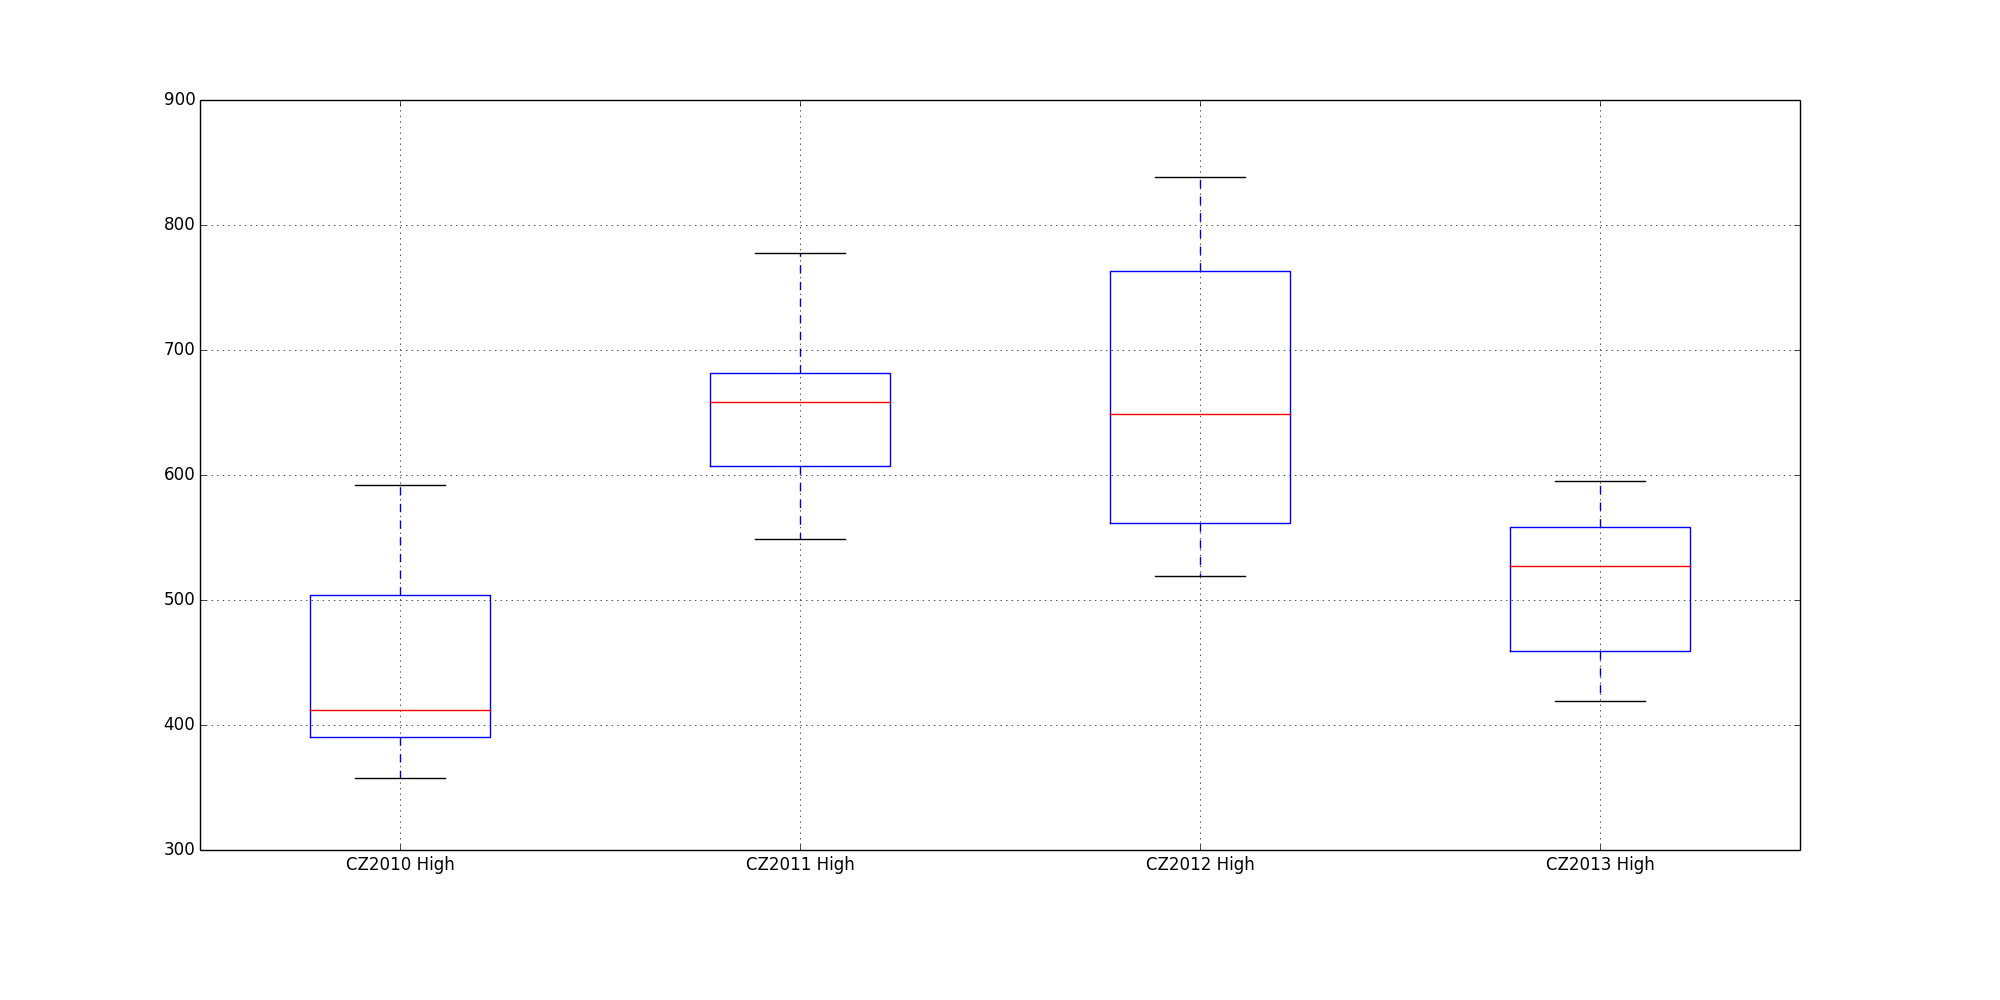
CZ2010 to CZ2013. Once again, not much difference. The next is why I included this series.
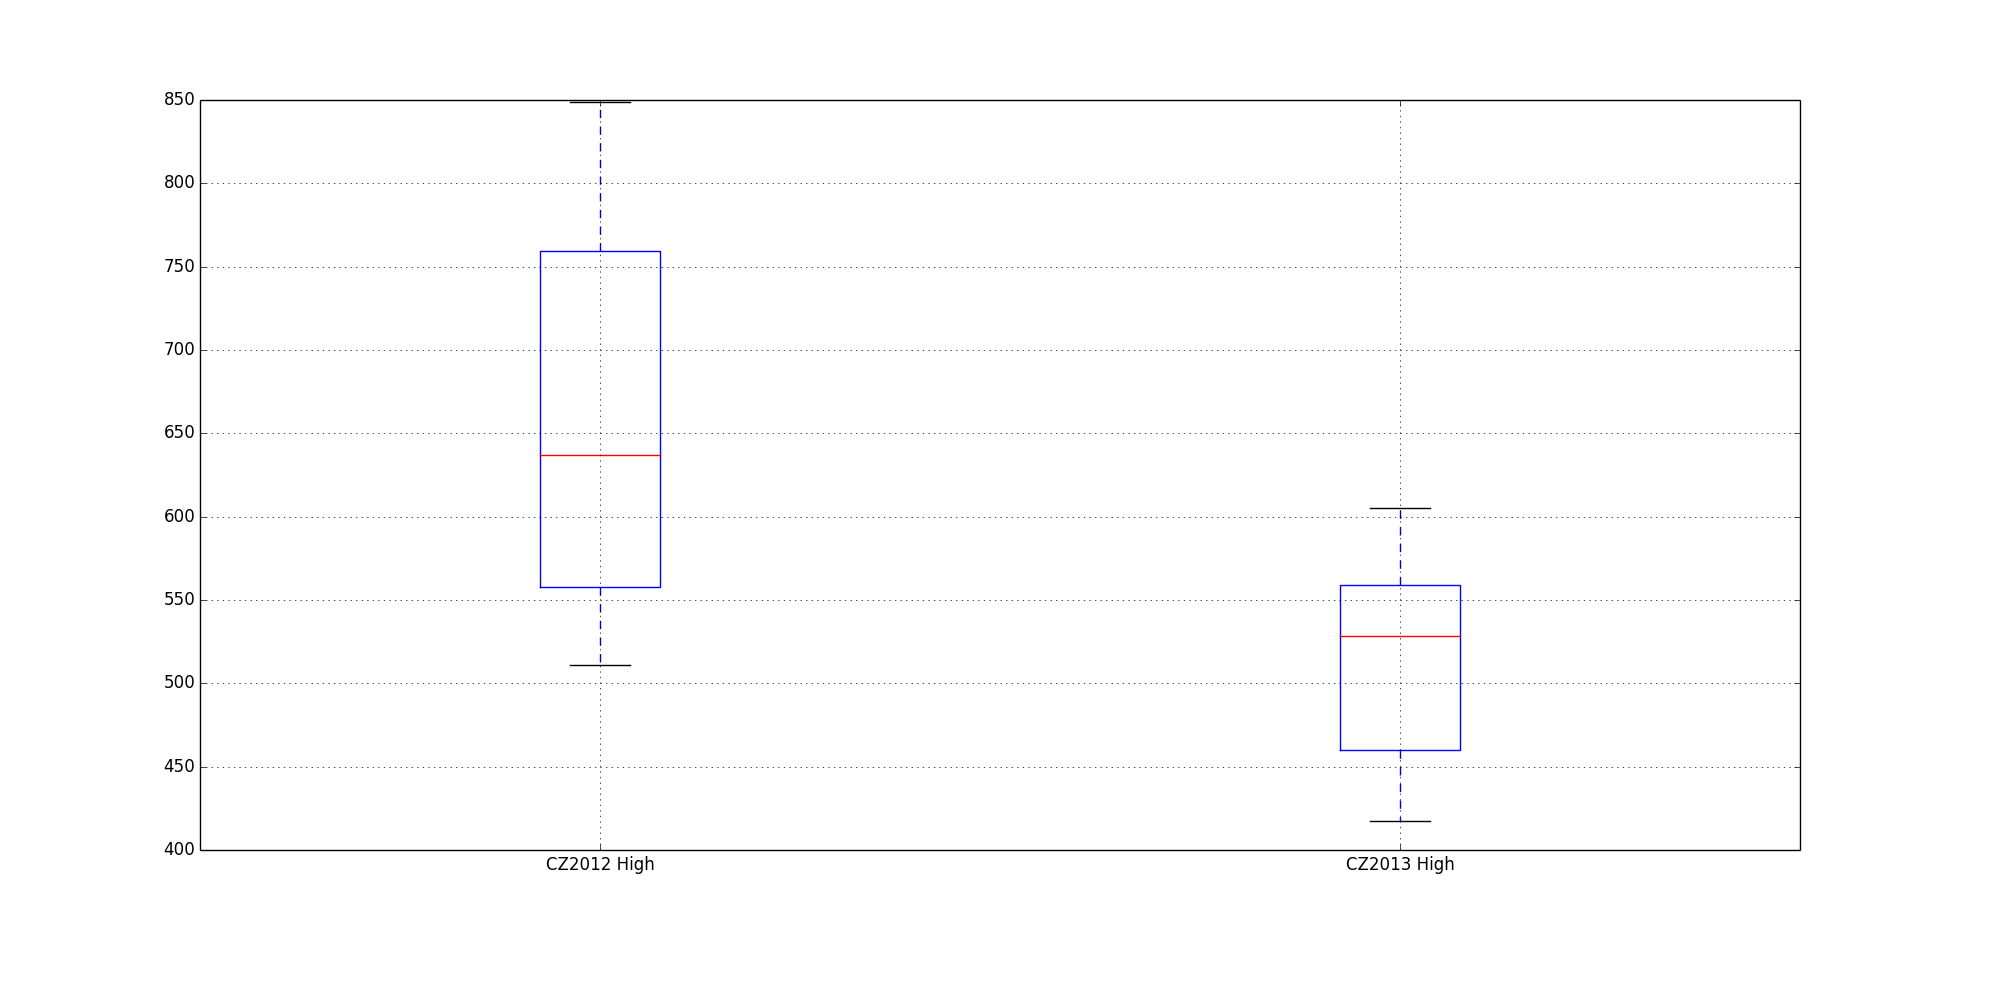
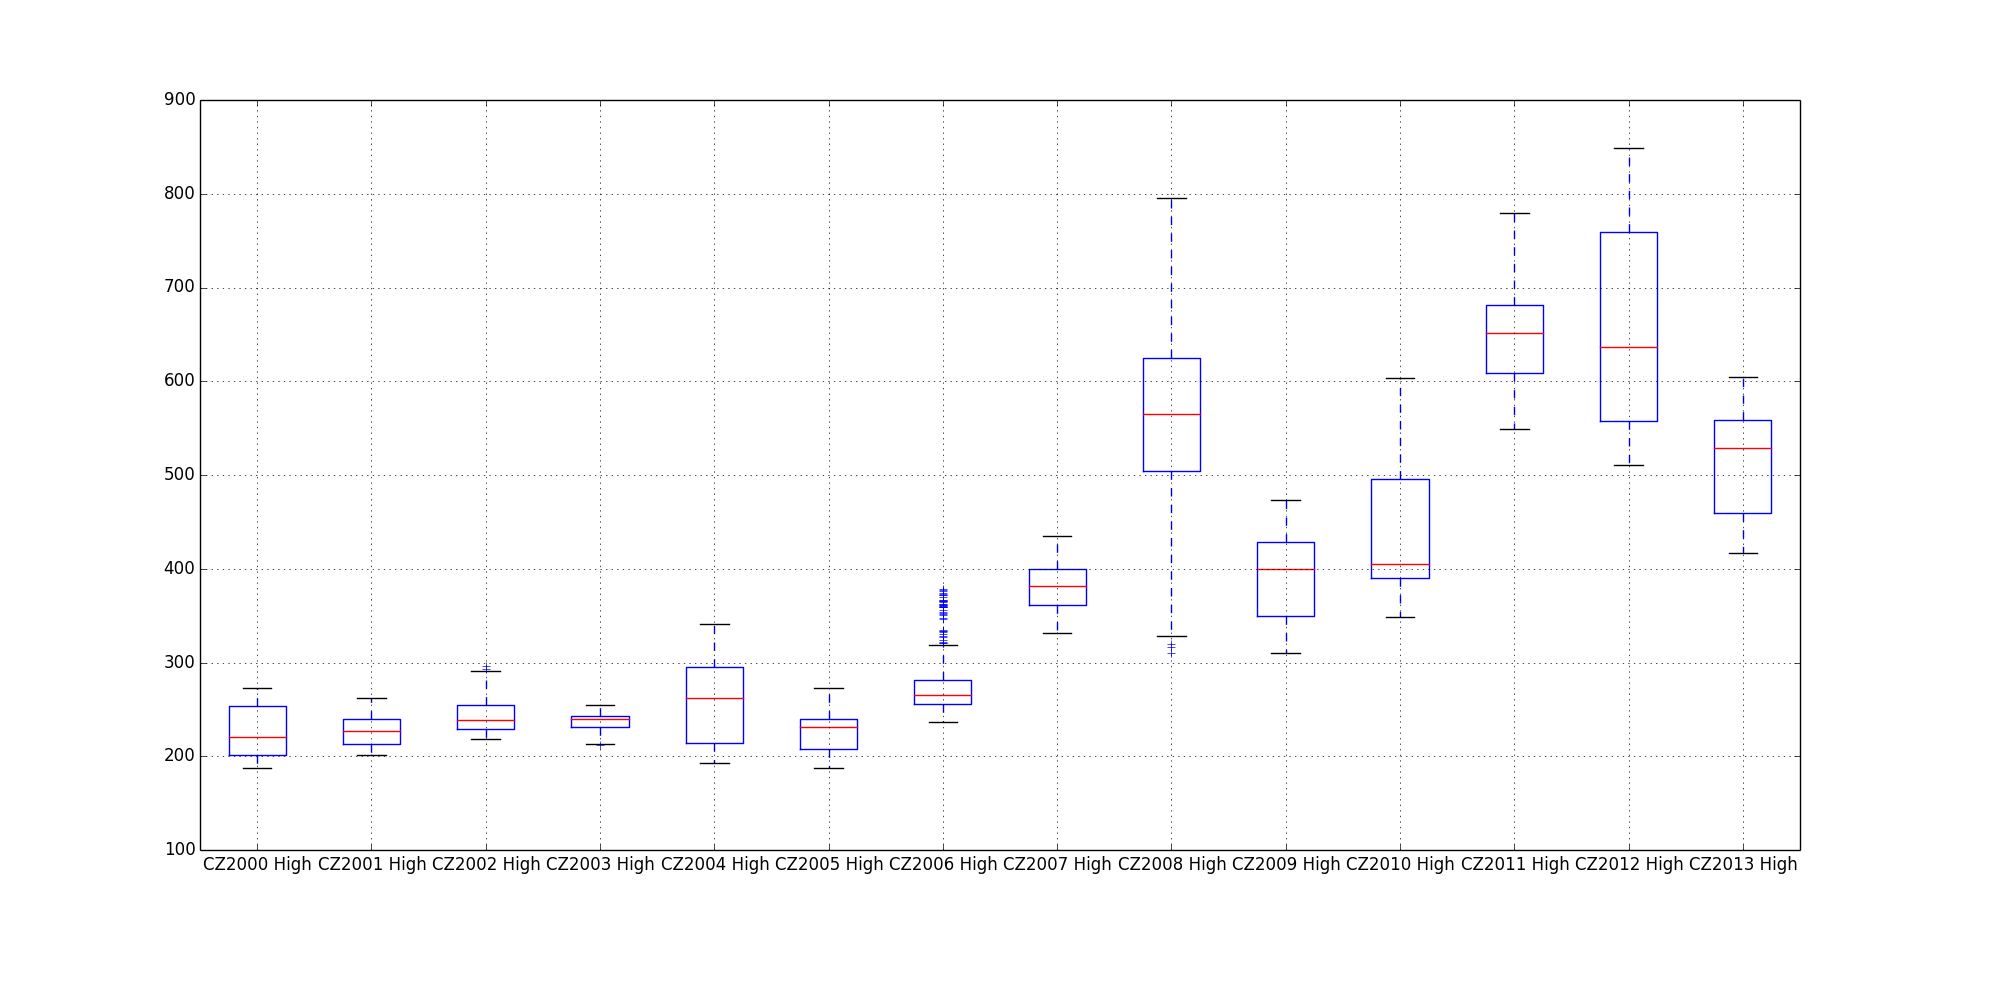
The graph is of CZ2000 to CZ2013 in a BoxPlot style. Got me what
that means. I'm guessing the red line is the mean. The box is either the
middle quartile... or more likely, first standard deviation. While the
dotted bracket indicates the overall range.
So, just shooting from the hip, that means:
CZ2008, in 2008, had a wider trading range than anytime else.
But, and this perhaps is more important, the actual profit-loss
range -- variance -- between investors would have been greater in 2012
for CZ2012.