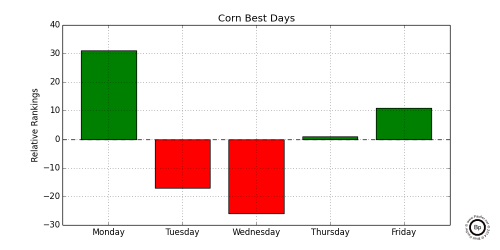
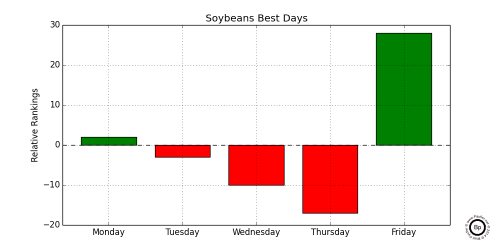
Best Day in Month
day = [0,0,0,0,0]

for year in range(start,2015):

    for month in range(1,month):

        tF = dF[dF.index.year == year]

        tF = tF[tF.index.month == month]

        tF = tF.sort("Settle")

        if best:

            day[tF.tail(1).index.weekday] += 1

        else:

            day[tF.head(1).index.weekday] += 1
Best Day in Month
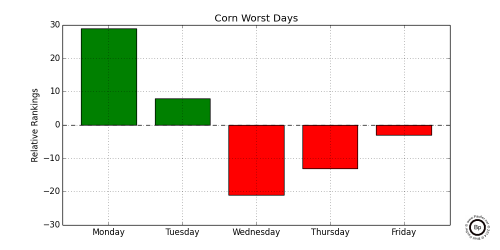
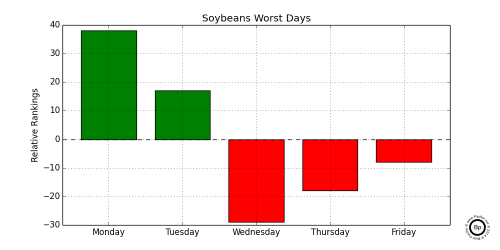
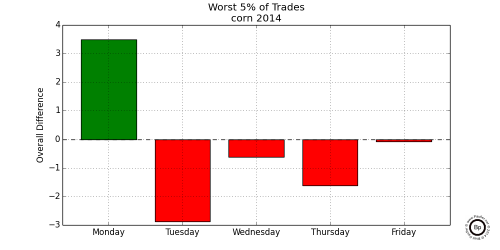
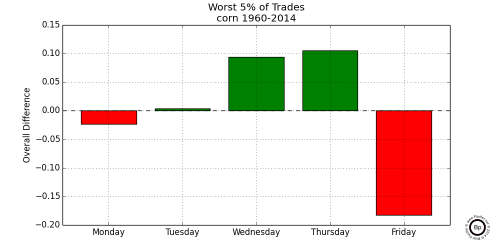
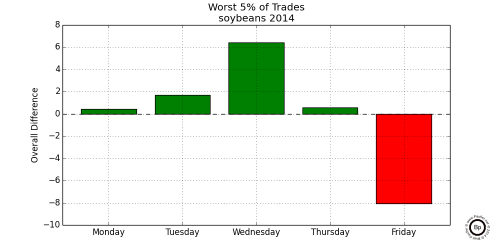
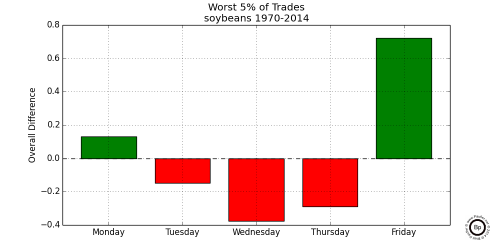
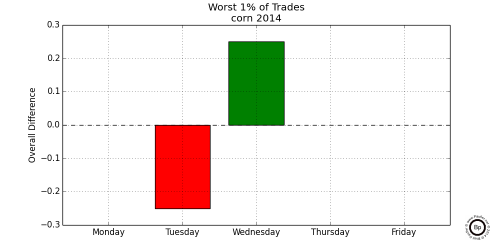
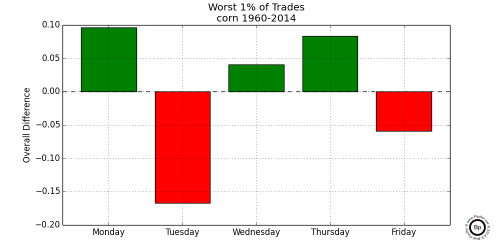
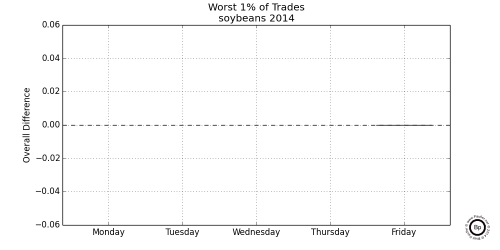
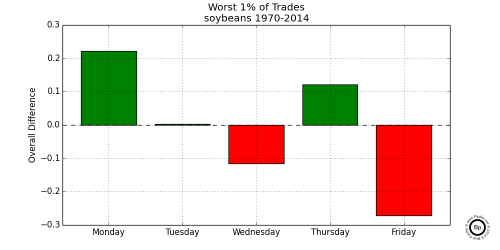
Worst Day in Month
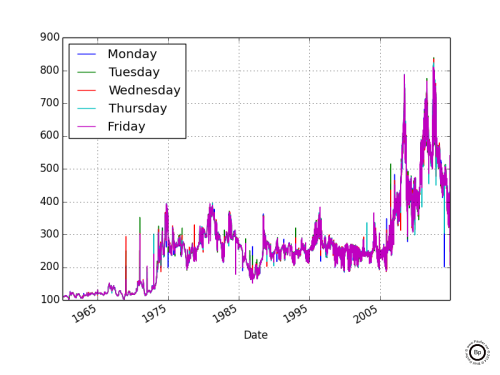
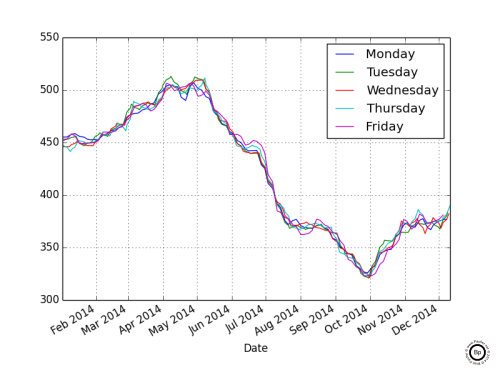
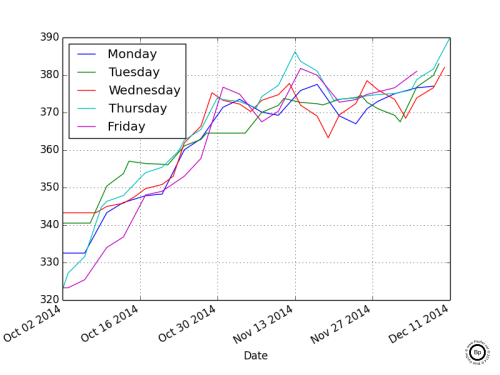
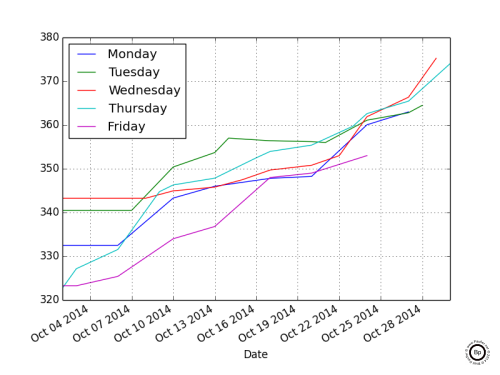
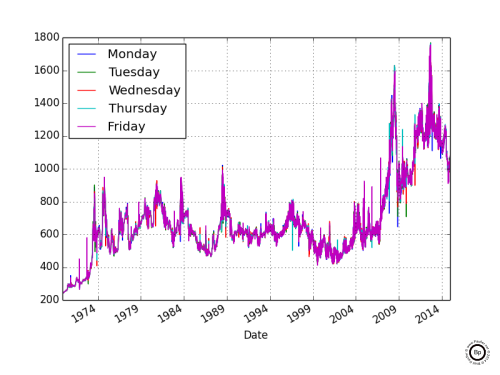
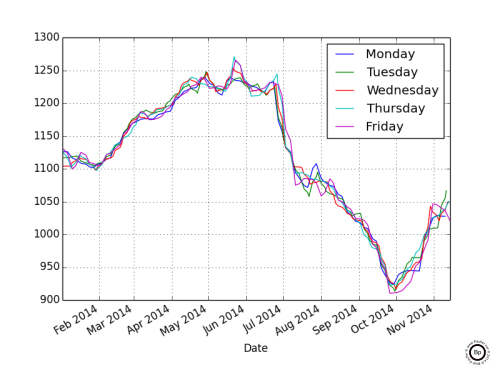
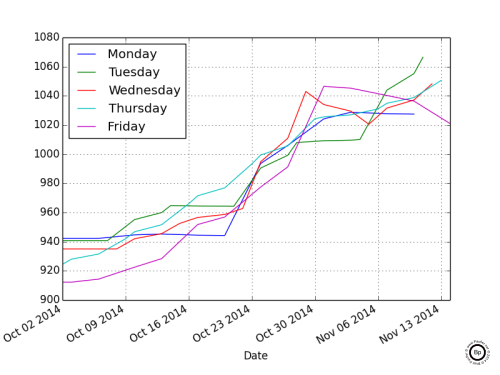
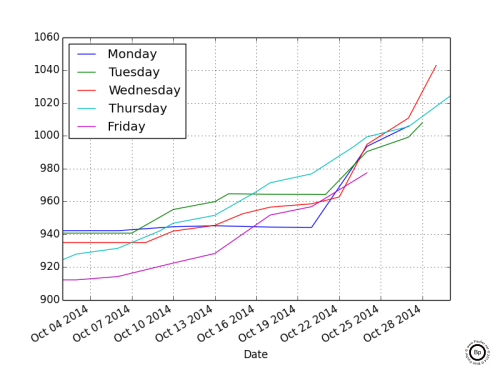
Settle Price of Corn Broken Out by Day of Week
Settle Price of Soybeans Broken Out by Day of Week
Monday = sum(mondayData)/len(mondayData) - average(allData)
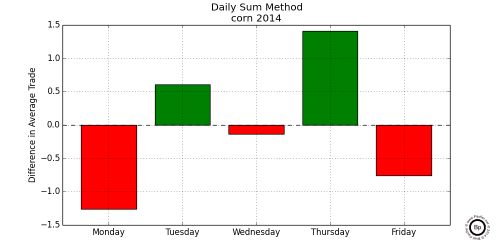
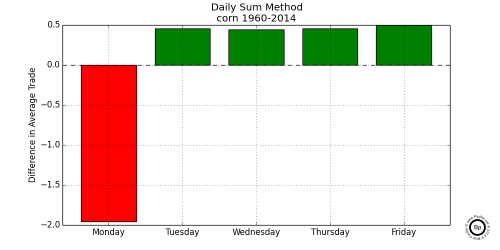
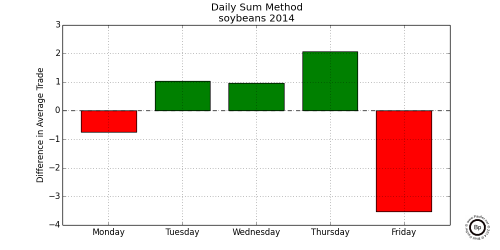
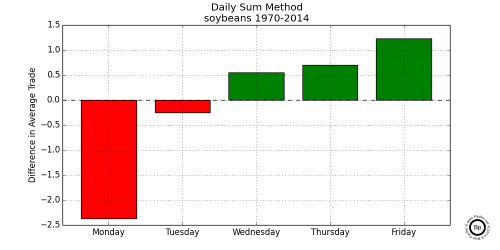
Simple Best Day by Sum Average Method
data = data.where(issue == year)

data = data.where(data == top_10_percent)


Monday = sum(mondayData)/len(mondayData) - average(data)
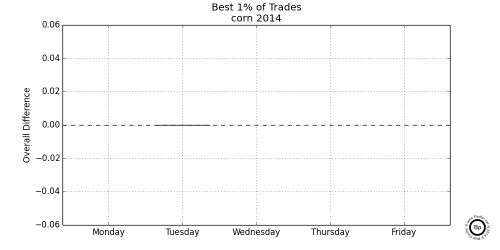
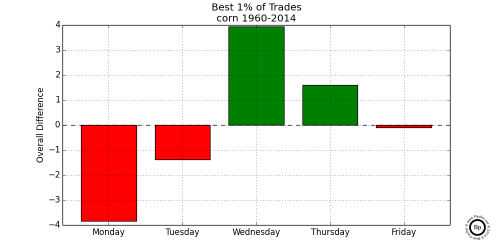
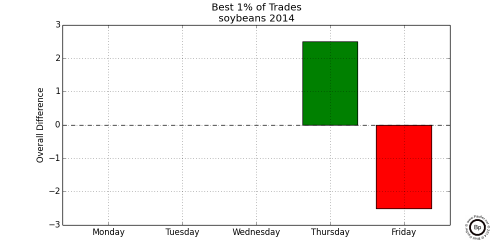
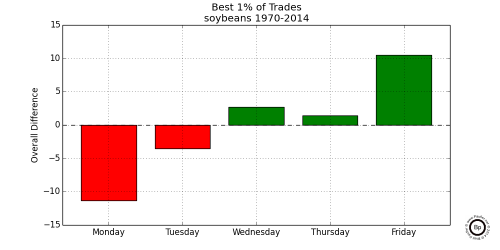
Best 0.01
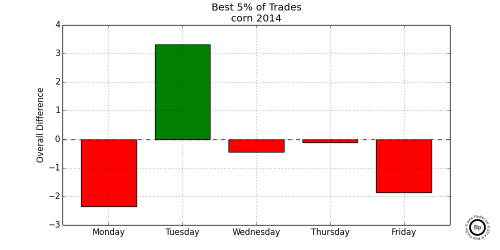
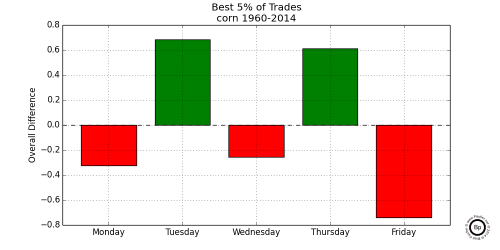
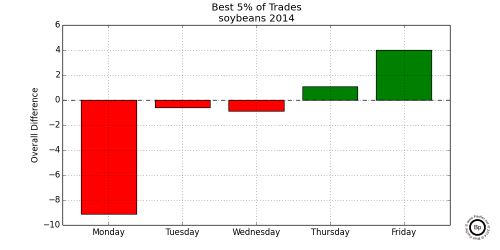
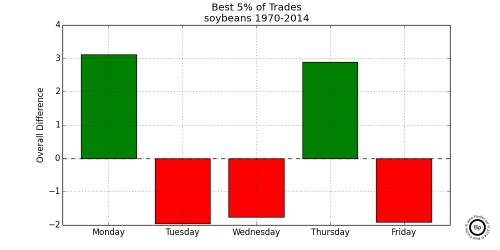
Best 0.05
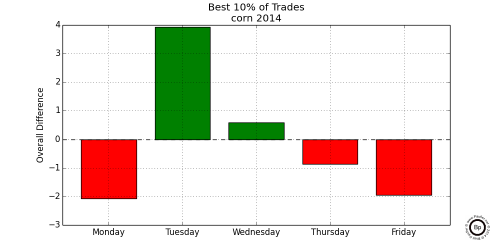
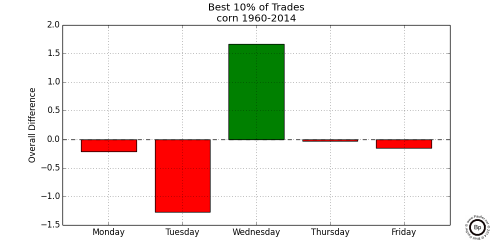
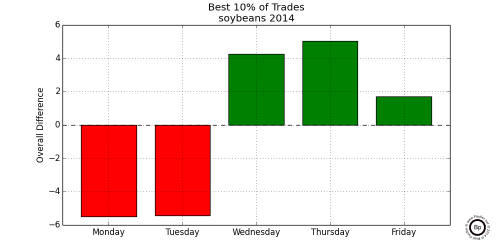
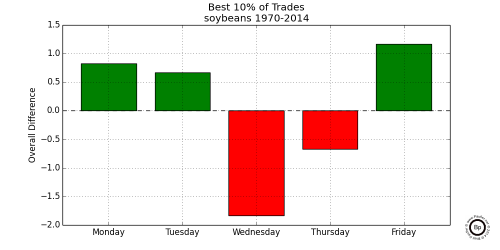
Best 0.10
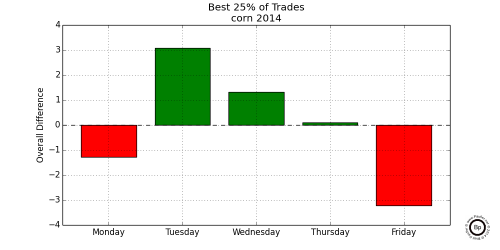
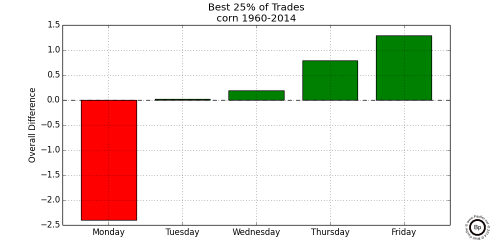
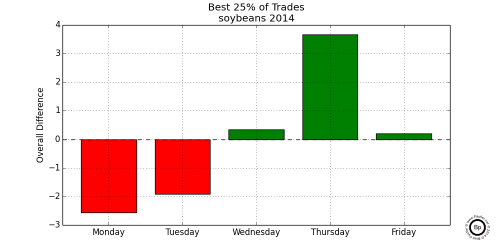
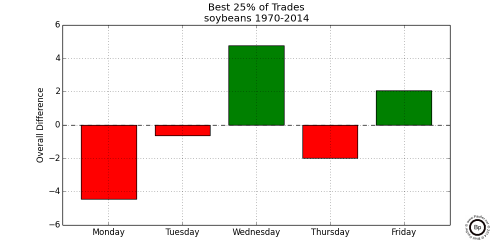
Best 0.25
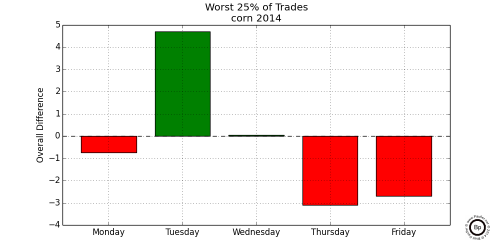
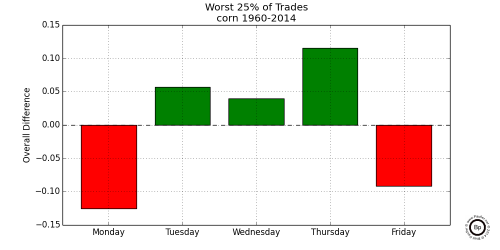
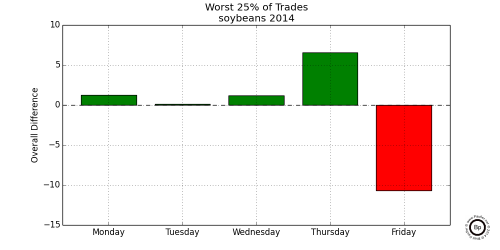
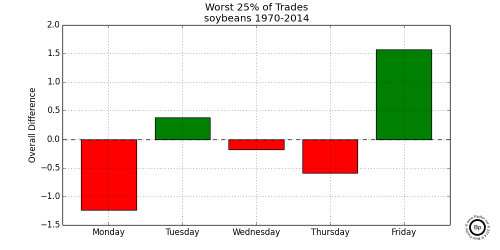
Worst 0.25
Worst 0.10
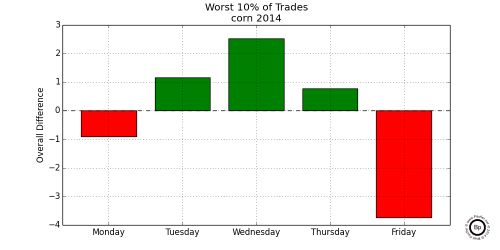
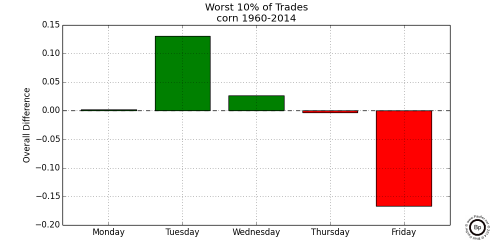
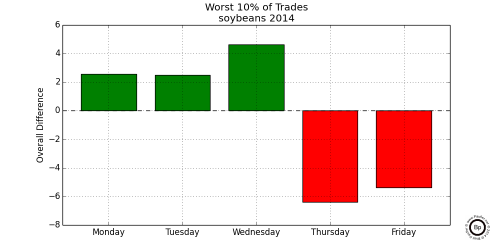
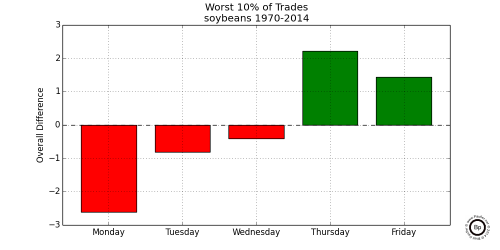
Worst 0.05
Worst 0.01
| Monday | Tuesday | Wednesday | Thursday | Friday | pValue | magnitude |
|---|---|---|---|---|---|---|
| 517.451515 | 517.895455 | 0.212669 | -0.443939 | |||
| 517.451515 | 517.70303 | 0.376590 | -0.251515 | |||
| 517.451515 | 517.381818 | 0.818248 | 0.069697 | |||
| 517.451515 | 516.757576 | 0.022114 | 0.693939 | |||
| 517.895455 | 517.70303 | 0.081895 | 0.192424 | |||
| 517.895455 | 517.381818 | 0.031233 | 0.513636 | |||
| 517.895455 | 516.757576 | 0.013165 | 1.137879 | |||
| 517.70303 | 517.381818 | 0.696113 | 0.321212 | |||
| 517.70303 | 516.757576 | 0.022363 | 0.945455 | |||
| 517.381818 | 516.757576 | 0.020105 | 0.624242 |
| Monday | Tuesday | Wednesday | Thursday | Friday | pValue | magnitude |
|---|---|---|---|---|---|---|
| 508.372605 | 508.688378 | 0.350577 | -0.315773 | |||
| 508.372605 | 509.38825 | 0.173412 | -1.015645 | |||
| 508.372605 | 509.046616 | 0.014682 | -0.674010 | |||
| 508.372605 | 508.311622 | 0.014805 | 0.060983 | |||
| 508.688378 | 509.38825 | 0.025619 | -0.699872 | |||
| 508.688378 | 509.046616 | 0.018526 | -0.358238 | |||
| 508.688378 | 508.311622 | 0.023642 | 0.376756 | |||
| 509.38825 | 509.046616 | 0.182308 | 0.341635 | |||
| 509.38825 | 508.311622 | 0.374430 | 1.076628 | |||
| 509.046616 | 508.311622 | 0.023810 | 0.734994 |
| Monday | Tuesday | Wednesday | Thursday | Friday | pValue | magnitude |
|---|---|---|---|---|---|---|
| 1198.194286 | 1198.075714 | 0.940657 | 0.118571 | |||
| 1198.194286 | 1198.73 | 0.017068 | -0.535714 | |||
| 1198.194286 | 1198.661429 | 0.014698 | -0.467143 | |||
| 1198.194286 | 1197.327143 | 0.013417 | 0.867143 | |||
| 1198.075714 | 1198.73 | 0.018595 | -0.654286 | |||
| 1198.075714 | 1198.661429 | 0.017434 | -0.585714 | |||
| 1198.075714 | 1197.327143 | 0.016414 | 0.748571 | |||
| 1198.73 | 1198.661429 | 0.115698 | 0.068571 | |||
| 1198.73 | 1197.327143 | 0.046024 | 1.402857 | |||
| 1198.661429 | 1197.327143 | 0.029681 | 1.334286 |
| Monday | Tuesday | Wednesday | Thursday | Friday | pValue | magnitude |
|---|---|---|---|---|---|---|
| 1160.338774 | 1160.598726 | 0.099886 | -0.259952 | |||
| 1160.338774 | 1161.324841 | 0.026171 | -0.986067 | |||
| 1160.338774 | 1162.039013 | 0.015582 | -1.700239 | |||
| 1160.338774 | 1161.269904 | 0.012297 | -0.931131 | |||
| 1160.598726 | 1161.324841 | 0.020731 | -0.726115 | |||
| 1160.598726 | 1162.039013 | 0.014790 | -1.440287 | |||
| 1160.598726 | 1161.269904 | 0.013819 | -0.671178 | |||
| 1161.324841 | 1162.039013 | 0.052408 | -0.714172 | |||
| 1161.324841 | 1161.269904 | 0.016025 | 0.054936 | |||
| 1162.039013 | 1161.269904 | 0.016307 | 0.769108 |
| Monday | Tuesday | Wednesday | Thursday | Friday | |
|---|---|---|---|---|---|
| Number Trades | 182 | 202 | 199 | 198 | 197 |
| Trade Average | 517 | 516 | 519 | 518 | 518 |
| Best Day | 47 | 29 | 35 | 43 | 50 |
| Over Average | 295 | 177 | 192 | 212 | 245 |
| Worst Day | 52 | 31 | 30 | 36 | 55 |
| Under Average | -321 | -172 | -145 | -233 | -383 |
| Net Difference | -26 | 5 | 47 | -21 | -138 |
| Monday | Tuesday | Wednesday | Thursday | Friday | |
|---|---|---|---|---|---|
| Number Trades | 875 | 950 | 954 | 939 | 931 |
| Trade Average | 507 | 507 | 508 | 508 | 508 |
| Best Day | 216 | 128 | 167 | 187 | 274 |
| Over Average | 1871 | 1036 | 1065 | 1230 | 2165 |
| Worst Day | 263 | 174 | 129 | 140 | 266 |
| Under Average | -2144 | -1318 | -780 | -1058 | -2505 |
| Net Difference | -273 | -282 | 285 | 172 | -340 |
| Monday | Tuesday | Wednesday | Thursday | Friday | |
|---|---|---|---|---|---|
| Number Trades | 190 | 208 | 206 | 204 | 205 |
| Trade Average | 1199 | 1193 | 1200 | 1201 | 1198 |
| Best Day | 47 | 37 | 36 | 33 | 57 |
| Over Average | 605 | 349 | 315 | 335 | 640 |
| Worst Day | 47 | 37 | 31 | 31 | 64 |
| Under Average | -568 | -420 | -268 | -308 | -863 |
| Net Difference | 37 | -71 | 47 | 27 | -223 |
| Monday | Tuesday | Wednesday | Thursday | Friday | |
|---|---|---|---|---|---|
| Number Trades | 685 | 748 | 749 | 734 | 729 |
| Trade Average | 1159 | 1158 | 1160 | 1162 | 1161 |
| Best Day | 154 | 133 | 120 | 126 | 222 |
| Over Average | 2404 | 1586 | 1237 | 1648 | 3263 |
| Worst Day | 201 | 134 | 110 | 92 | 218 |
| Under Average | -2995 | -1712 | -1092 | -1217 | -3533 |
| Net Difference | -591 | -126 | 145 | 431 | -270 |